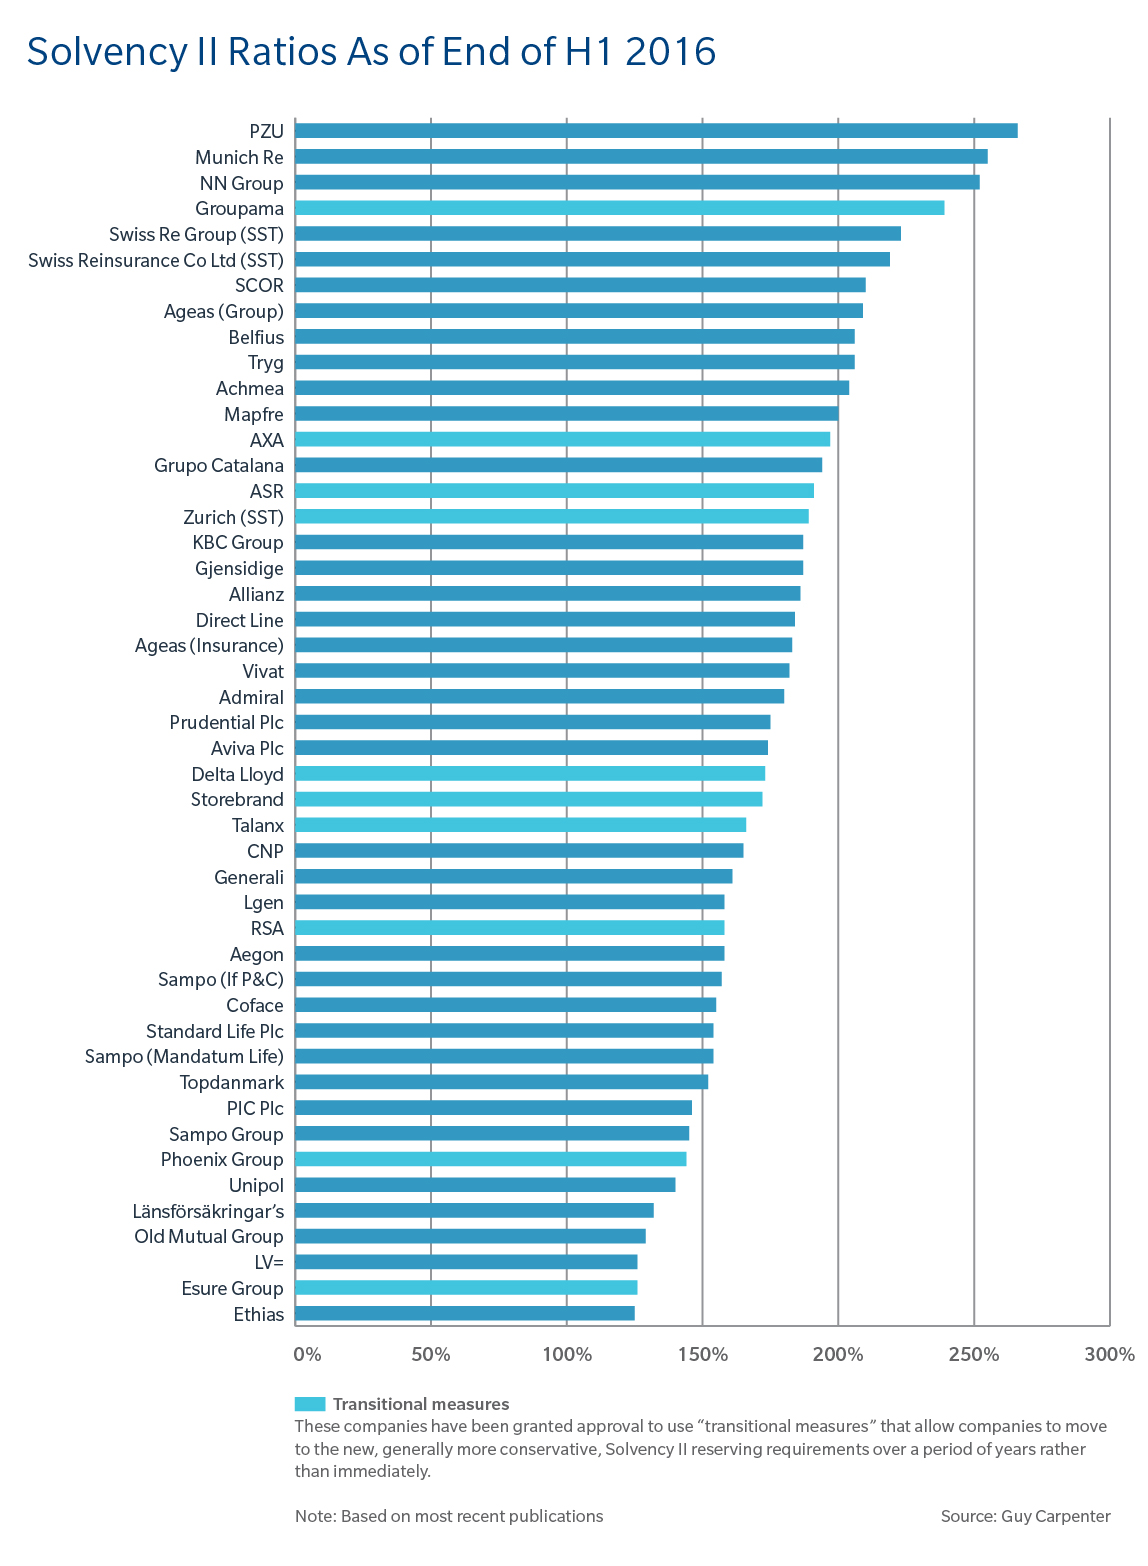
Chart presents (re)insurers' Solvency II ratios compiled by Guy Carpenter for the first half of 2016. Many companies publish their solvency ratios without being required to do so, and some others actually specify target solvency ratio ranges as part of their risk appetite and financial targets. Solvency ratios are another metric for investors to use when assessing the relative financial strength of companies - and (re)insurance buyers can do the same when assessing counterparty risk.
