
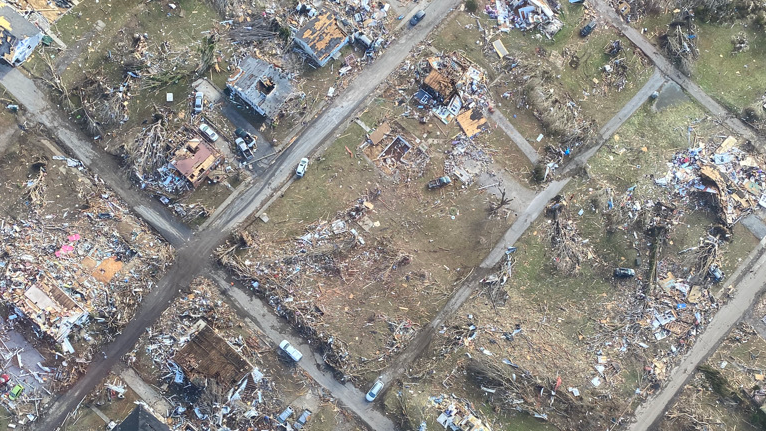
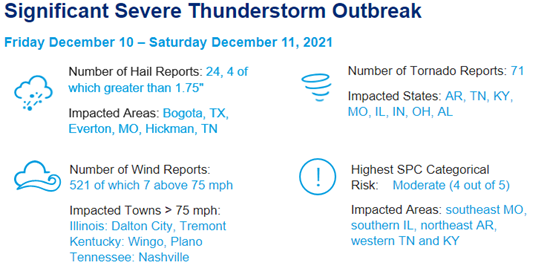
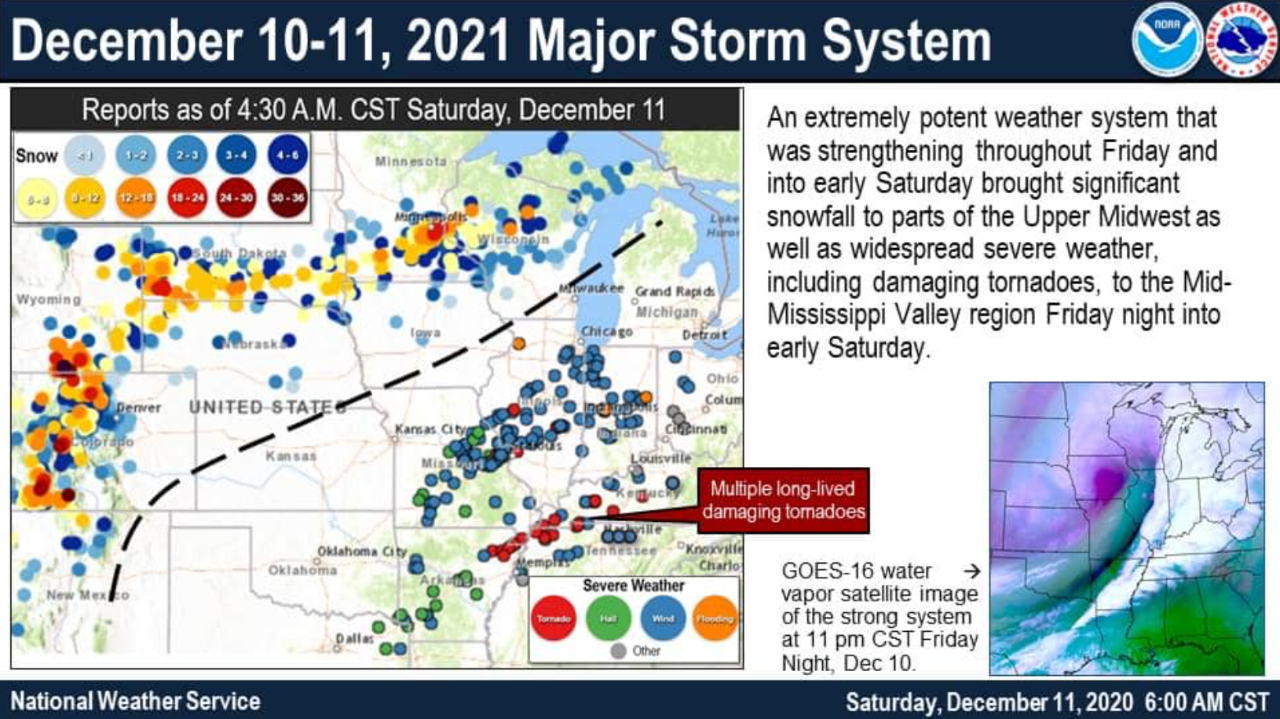
On the evening of Friday December 10, 2021, a strong cold front intersecting record warm temperatures across the Mississippi and Ohio River Valleys initiated widespread thunderstorm activity. Near ideal conditions existed for long track, severe tornadoes across multiple states. Due to the nocturnal nature of the storms, fatality rates are high, with estimates as of publication of at least 88 fatalities across multiple states resulting from at least 30 tornadoes in the region. The longest track tornado, crossing the states of Arkansas, Missouri, Tennessee and Kentucky is potentially in excess of 250 miles long, likely breaking the former record of a single tornado of 219 miles in the Tri-State 1925 outbreak. Insured losses are estimated to be as high as the mid-single digits of billions of dollars, as several communities including Mayfield, KY, Monette, AR, Edwardsville, IL and Bowling Green, KY saw damage of EF-3 or higher.
The December 2021 Multi-State Tornado post-event report comprises the following sections:
- Insured Loss Estimates
- Regional Impacts
- Implications for the Insurance Industry
- Key Dates in the Timeline of the Multi-State Tornado Outbreak
- Physical Discussion of Meteorological Conditions
Insured Loss Estimates
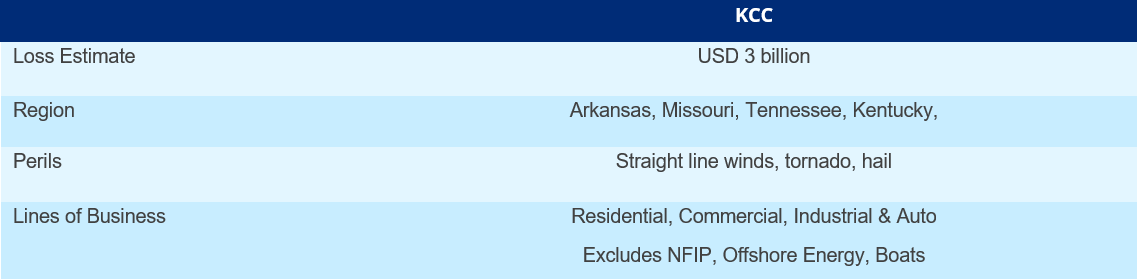
As of Wednesday, December 15, 2021, the only vendor to issue loss estimates was Karen Clark & Company (KCC). Most vendors do not issue severe convective storm (SCS) loss estimates due to the high granularity of damage footprints, especially with tornadoes, which can make accurate loss estimates hard to determine. KCC’s initial industry loss estimate is just below USD 3 billion on an industry basis, inclusive of tornado, straight-line wind and hail losses. Exposure includes auto, residential, commercial and industrial lines. Other unattributed commentary suggests losses as high as $7B on the high side, nearing the level of loss associated with the Iowa and Illinois derecho in 2020, but are likely aggressive with the early knowledge of the event.
With a lack of model vendor estimates, the following insured loss statistics provide a range of benchmarks that can help formulate plausible ranges of loss outcomes with the multi-state tornado outbreak, inflation adjusted to 2021 dollars:
- Largest SCS industry losses on record: USD 8-10 billion with the 2011 outbreaks of Joplin, MO and Tuscaloosa, AL
- Largest Kentucky SCS industry loss: USD 1.6 billion in 2002, part of a larger industry event that tallied USD 3-3.5 billion of loss
- Top ten largest SCS industry losses on record: USD 4-10 billion.
Regional Impacts
United States
FEMA has opened 11 shelters in Kentucky and three in Tennessee to help those displaced by the tornadoes. 52 generators, 30,000 meals, 45,000 liters of water along with cots, blankets, medical equipment and supplies are being deployed. The American Red Cross has opened eight additional shelters in Kentucky. This single event will eclipse all the fatalities nationwide experienced in 2020 at 76 deaths.
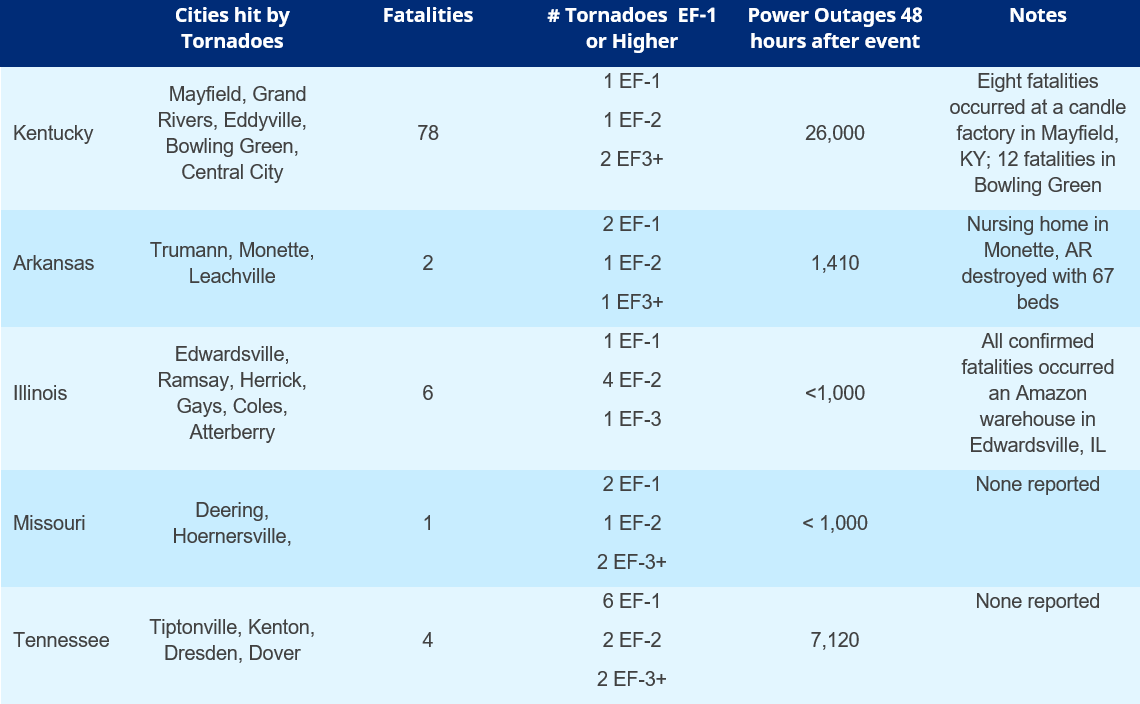
Kentucky
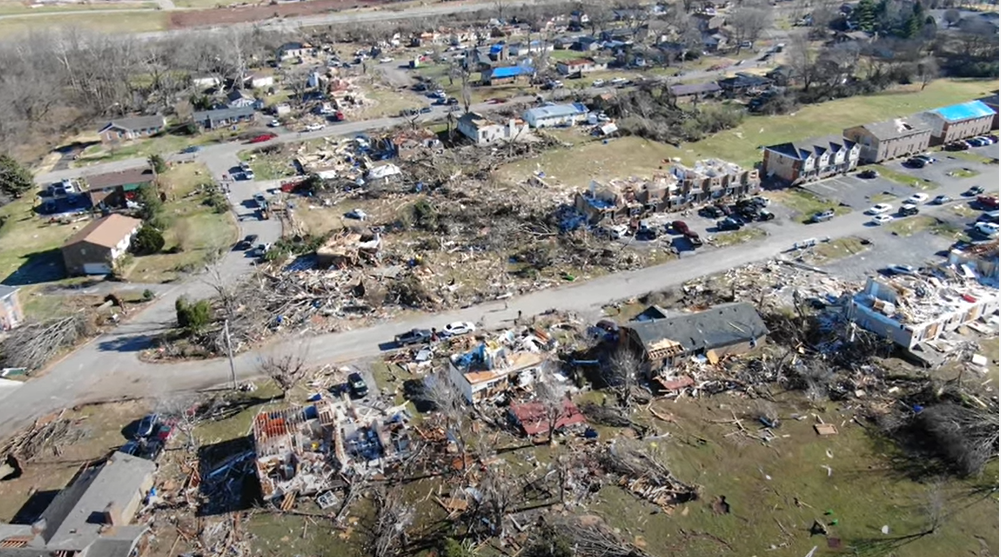
Kentucky was the most severely impacted state from a damage and fatality perspective. Fatalities are expected to increase to potentially over 100. Since 1950, 148 fatalities in Kentucky are attributed to severe thunderstorm activity, ranking the 16th highest state in terms of tornado fatalities prior to this event. 300 national guardsmen have been deployed to conduct search-and-rescue missions for those towns most heavily impacted. As of mid-day Monday, 105 people are reported missing across the state. The most heavily impacted communities, ranked by population, are Mayfield (10,000), Central City (5,750), Eddyville (2,525) and Grand Rivers (375). In Mayfield, heavy infrastructure damage occurred as the town’s water tower took a direct hit from a tornado and collapsed. The outskirts of Bowling Green, KY also saw an EF-3 tornado, which skirted the periphery of the 73,000 person population center. 12 confirmed fatalities are confirmed in a housing sub-division southwest of downtown while a 100,000 square foot automotive plant also was severely damaged.
Arkansas
One resident was killed in a 67-person nursing home facility in Monette, AR, located 20 miles east of Jonesboro. Aerial footage reveals total devastation of the facility. An additional fatality transpired in Leachville, AR at a Dollar General store.
Missouri
Tornadic supercell thunderstorms tracked across St. Charles and St. Louis counties between 7:30pm – 8:00pm Friday evening. One fatality was reported in Defiance, MO by an estimated EF-3 tornado. Several additional tornadoes were confirmed but no fatalities are reported.
Illinois
An Amazon warehouse near Edwardsville, IL took a direct hit from an EF-3 tornado, resulting in six fatalities. While the areas had nearly 30 minutes of notice time between the issuance of tornado warnings and the time of impact, most employees did not have cell phones with them, nor reportedly access to real-time alerts. 45 workers survived the damage at the Amazon facility. Additional EF-2 tornadoes were reported in Cass County near the town of Virginia and Shelby County near Herrick, IL.

Implications for the Insurance Industry
Between the time of year, the number of EF-3 or higher tornadoes, and the length of the long-track tornado across four states, this event raises several implications for the insurance industry.
Rare December SCS Outbreak in the United States
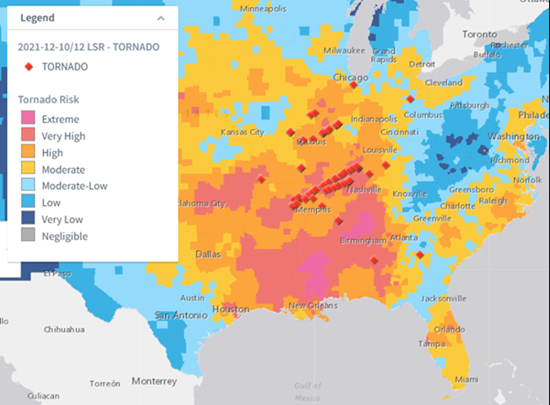
On average, there are 1,500 tornado events per year in the United States, with only 25 occurring in December. This particular outbreak was exceptionally rare in terms of the season, the intensity and the length of the storm paths. These tornadic supercells formed in Arkansas and Missouri, and then tracked hundreds of miles through Illinois, Tennessee and Kentucky. The Storm Prediction Center (SPC) tornado reports for December 10 are plotted below, with an overlay of the Tornado Index sub-peril version of the Guy Carpenter Severe Thunderstorm Risk Magnitude Index (SToRMi). SToRMi was developed in order to quantify the noteworthy increase in both the frequency and severity of severe thunderstorm losses over the last decade. There is very good agreement between the recent outbreak and the location of elevated risk for tornado according to SToRMi.
Another Costly Severe Convective Storm Year
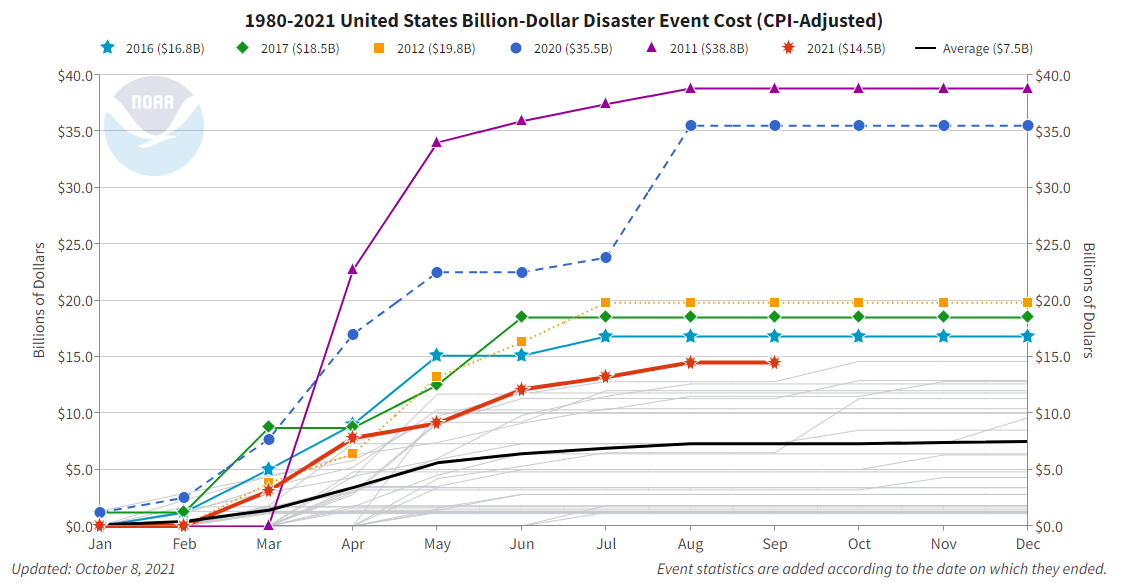
With expectations of a multi-billion dollar industry loss from the outbreak, this will be the tenth billion dollar severe convective storm industry loss in 2021, the second highest number of annual events behind last year with 13 SCS billion dollar loss events. Aggregate losses for 2021 look to be well behind the two highest SCS loss years of the last ten, which were 2011 and 2020. Leveraging NOAA’s billion-dollar database, this year will likely be more comparable to the loss years of 2012, 2017 and 2016 from an SCS perspective. With only billion dollar or higher events being counted in the NOAA database, seasonal totals will be underestimated as smaller loss events less than USD 1 billion are not included in seasonal totals.
Is the December Multi-State Tornado Outbreak Connected to a Changing Climate?
The economic toll brought by weather frequency and severity is increasing across the United States in recent years as evidenced by increased insured losses. However, unlike other weather events like drought and floods, the connection between climate change and tornadoes is not well understood or quantified. Importantly, the exact physical processes involved in a severe thunderstorm producing a dangerous tornado is still a very active area of research and investigation. Temperature is an important component in thunderstorm and tornado development, but the understanding of how rising temperature affects thunderstorm ingredients, such as wind shear and instability, is more limited. While the exact science of this connection remains uncertain, there are signs that indicate potential shifts in tornado frequency and intensity with a changing climate.
Severe thunderstorms are rare in the winter months because air masses are typically not warm enough to create a significant amount of atmospheric instability. In this event, once thunderstorms formed in an unstable atmosphere, strong wind shear due to the robust winter jet stream over the north-central U.S. allowed the storms to strengthen into supercell thunderstorms and persist for hours. As late autumn and early winter features more warm air masses in a warming climate, it is possible that these types of conditions favorable for producing tornados will increase over North America, causing an elongation of the severe weather season.
A recent CBS News Interview with Guy Carpenter research partner, Dr. Victor Gensini of Northern Illinois University, summarizes additional factors at play in the escalating economic cost of tornadoes:
- While science cannot say with certainty that these specific events can be attributed to climate change, there is evidence that in aggregate tornados are changing in where they occur and changing in their intensity.
- Recent observations into tornado conducive environments show decreasing activity in the Great Plains, but an eastward shift to increasing activity in the mid-South states like Kentucky.
- This shift eastward brings an exposure and vulnerability component into play. Structures in the mid-south are predominantly a weaker building stock and more vulnerable to damage.
- Guy Carpenter research partner Dr. Stephen Strader of Villanova University and co-author Dr. Walker Ashely at Northern Illinois University have shown that as cities grow larger and we have a greater human footprint on the earth, there will be more large-scale tornado disasters in the future.
Regardless of a changing climate, the economic impacts of severe weather events are increasing as population centers and infrastructure assets grow and concentrate.
Nocturnal Tornadoes Proven to Result in Higher Fatalities
Several studies highlight that night-time tornadoes result in higher fatality counts. While December traditionally has the lowest number of nighttime tornadoes of any month, late autumn and early winter severe weather outbreaks tend to propagate into the night due to earlier sunset times. Studies find that even in the midst of a tornado warning, the public wants to be able to confirm the threat visually before taking cover. Another aspect of nocturnal events is not having proper notification of an impending tornado with either a phone alert, a weather radio, or ability to hear tornado sirens during sleep. A study conducted by Dr. Walker Ashley of Northern Illinois University found that the three states with the highest percentage of nighttime tornadoes are Kentucky (42%), Arkansas (43%) and Tennessee (46%). There is an outsized prospect of fatalities at night in mobile homes, where 61% of all deaths in a mobile home occur at night. As seen in Figure 5 below, Guy Carpenter research partner, Dr. Stephen Strader of Villanova University, estimated that approximately 40,000 people live directly underneath the long track tornado that potentially tracked through four states over a distance of more than 250 miles.
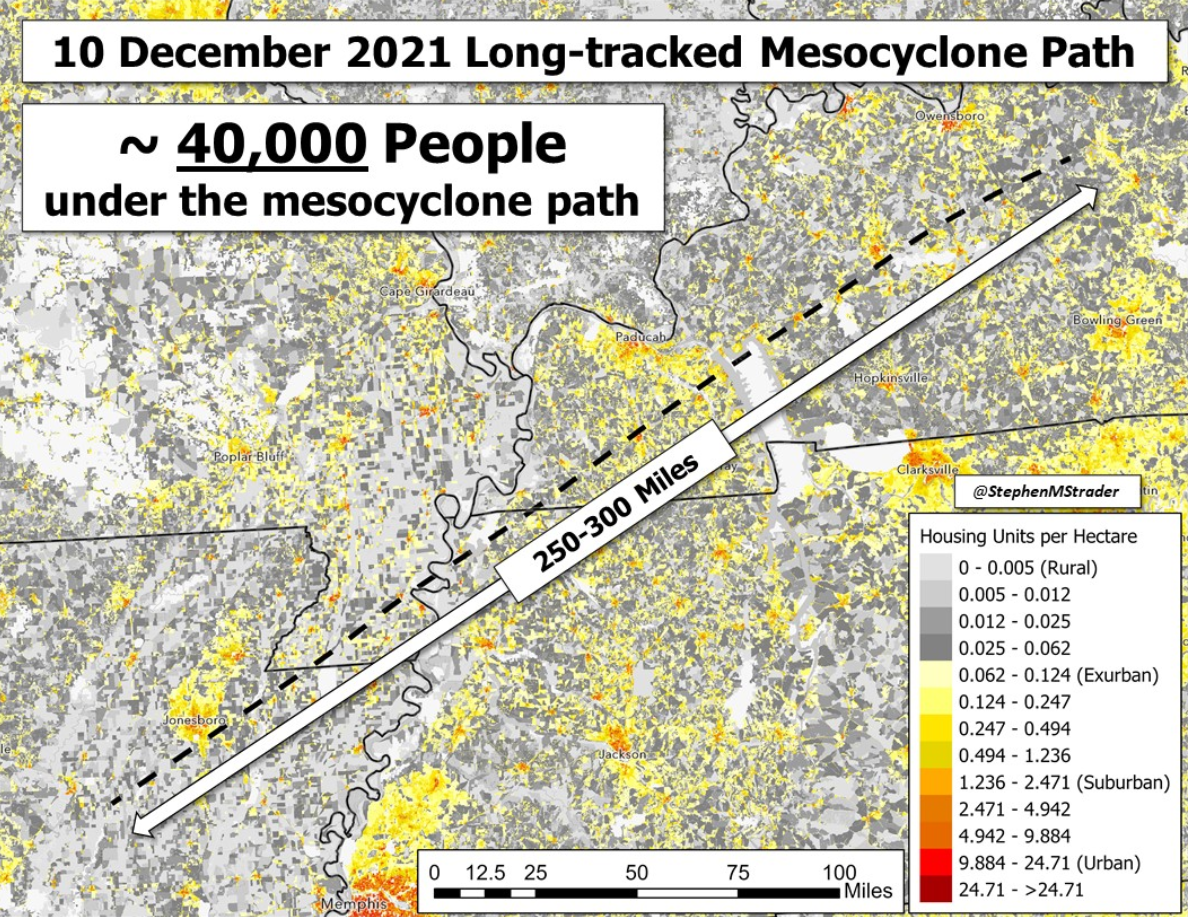
While this event is devastating in many aspects, a track that deviated by 40 miles or less from observations would have expanded potential population centers of much larger magnitude, including Memphis, TN (633,000), Louisville, KY (1,260,000) and Clarksville, TN (125,000). For comparison, the 2011 tornadoes were most impactful in Joplin, MO (52,000) and Tuscaloosa, AL (102,000) at EF-5 and EF-4 strength.
Getting a More Confident Answer with Tornado Swath Data
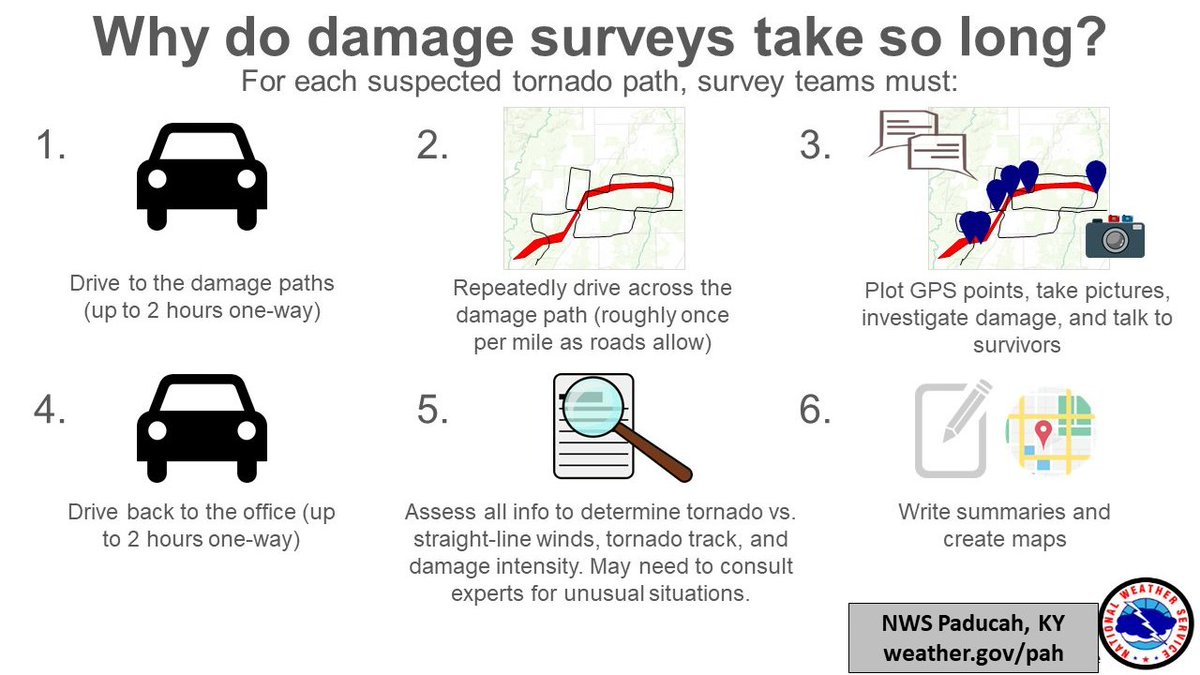
In the midst of a severe thunderstorm outbreak, immediately available data points on the breadth and intensity of wind, hail or tornado activity is limited to storm reports that are sent to the National Weather Service via emergency managers, observations at airports, law enforcement or the general public. Storm reports are a first initial estimate, as several issues can arise, from not having wind speed ratings for wind or tornado reports, as well as guestimates of hail size based on common objects (dime, quarter, baseball size, etc.). Specifically with tornadoes, limited reports result in gaps of miles where a tornado may have occurred but was not reported. While doppler radar can detect rotation in the clouds, it may not be representative of a tornado on the ground causing damage. Satellite and aerial imagery post-event can assist in determining the extent of a tornado swath with drone imagery helping to assess initial intensity bands. However, for a full rating of a tornado, meteorologists with the National Weather Service need to survey the damage on the ground. Specific characteristics of damaged structures are analyzed to estimate the peak wind speeds associated with the damage and debris. With a large tornado outbreak, this process can take as much as 5-7 days, as highlighted in the steps in Figure 6. Armed with the on-the-ground intelligence, one can finally have higher confidence in the outcomes to make more specific loss assessments.
Implications for Workers Compensation, Life, Accident and Health Coverages
With several large commercial losses transpiring in this tornado outbreak, workers compensations losses can be material where numerous employees are impacted at a single facility. Severe convective storm is not a modeled peril for workers compensation, thus injuries and fatalities can be a non-modeled source of insured loss. The timing of the tornadoes impacting large structures occurred on Friday evening, likely limiting peak casualties due to the occurrence outside normal business hours. Site-specific factors will also play a role, from alert notification of tornado warnings to the durability of shelters available in the instance of a tornado event. Other coverages potentially implicated in the tornado outbreak include life, accident and health coverages for fatalities and long-term disability payments for those injured.
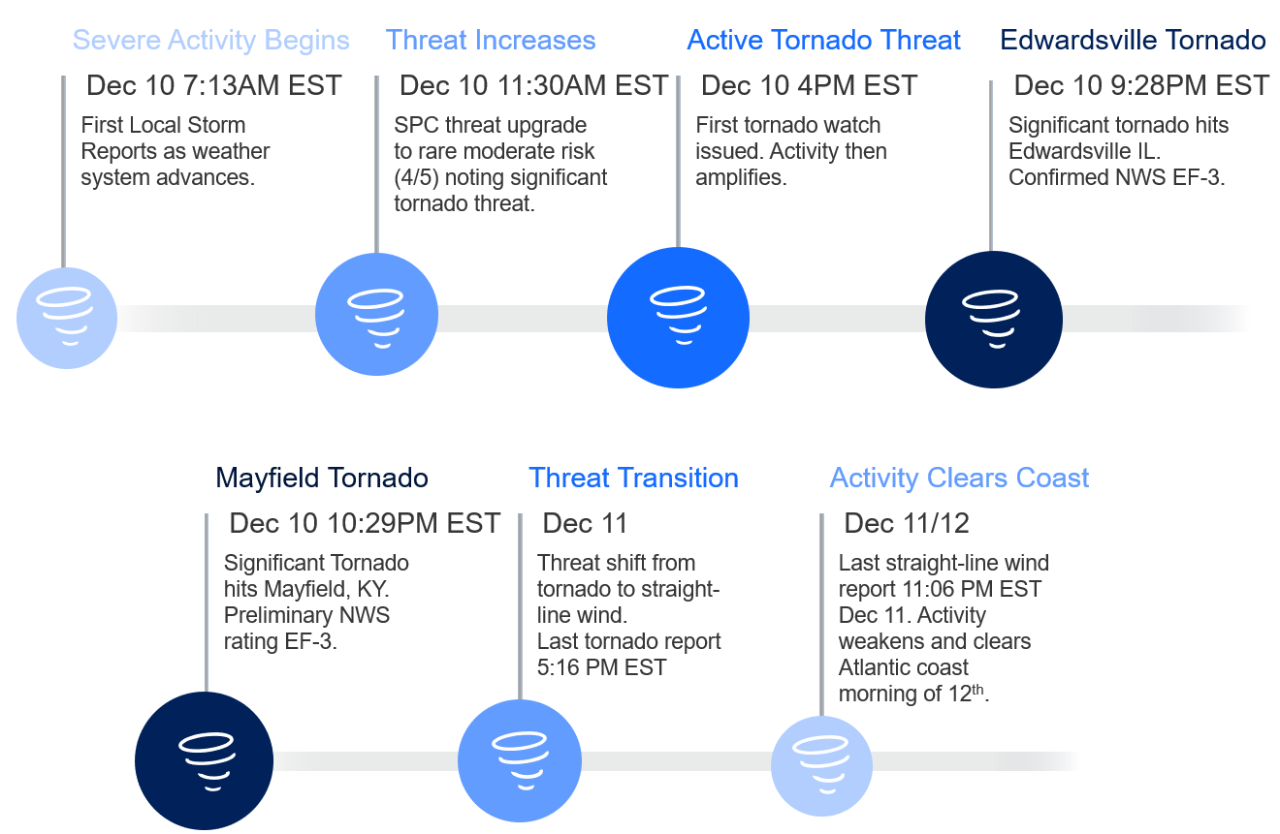
Key Dates in the Timeline of the Multi-State December Tornado Outbreak
Physical Discussion
As evident from media reports, a severe thunderstorm outbreak affected areas from the Northern Gulf States to the Central Mississippi Valley the evening of December 10 into the early morning hours of December 11. These thunderstorms produced reports of tornadoes, hail and straight-line wind damage. Specifically, several long-track, significant tornadoes were confirmed by the NWS. Damage survey efforts are underway by local NWS offices and it will take time to finalize results given the complexity of the event and access limitations due to the extent of damage.
Notable Long Track December Tornadoes
One confirmed tornado directly affected Mayfield, Kentucky and caused severe to complete damage to the town. The NWS has issued a preliminary rating of at least EF-3 for this tornado, consistent with complete removal of roof and exterior walls for most wood-frame homes; damage to more resilient structures is also apparent from initial reports in the area. As of Monday morning, many areas were still inaccessible and new findings may alter these intensity estimates. Another confirmed EF-3 tornado crossed near Edwardsville, Illinois along Interstate-270 just outside of Saint Louis, causing extensive damage to the Amazon warehouse in the area.
Tornado outbreaks of this severity are rare in December, but not unprecedented, and are generally limited to the Northern Gulf States. Only twenty five days with (E)F-3 or higher tornadoes have been observed in the affected states (Illinois, Kentucky, Tennessee, Missouri) according to confirmed NWS tornado records from the 1950s to 2020.
Factors in Place for Long Track Violent Tornadoes
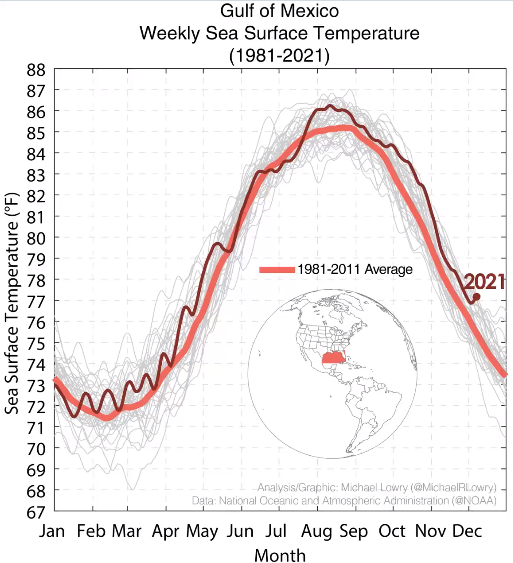
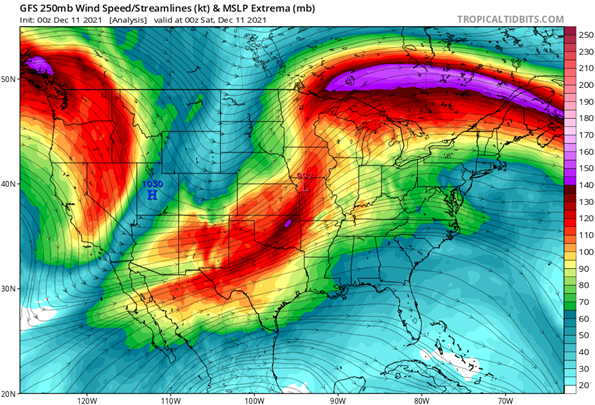
Thunderstorm activity initiated during the daytime hours of Friday, December 10 in an environment of warm, moist air with adequate instability and very robust wind shear, ahead of a potent frontal system crossing the area. The wind shear included changing wind speed and direction with height, especially at lower levels, allowing for robust tornado development. Discrete, rotating supercell thunderstorms developed in this environment, including one that crossed from Arkansas to Kentucky over a distance of well over 400 miles (associated with a small pocket of very aggressive upper-air support). Many of these supercells produced significant tornadoes. Additionally, winds flowing north out of the Gulf of Mexico ahead of the cold front emanated over record warm sea surface temperatures in the Gulf of Mexico for mid-December. The nocturnal activity was fueled by both the elevated wind shear and moisture-laden air mass ahead of the front.
The northward extent of this outbreak was enabled by a southwest to northeast orientation of the storm track as shown below, and an associated potent frontal system at the surface. The aggressive circulation allowed warm air from the Gulf of Mexico to be drawn into the Central Mississippi Valley, in contrast with Arctic air to the north and west of the frontal system. Such an occurrence is more common in the spring but has been observed during the cold season months during La Niña episodes. In La Niña winters, tornado activity is more common due to the polar jet stream being located further north across the continental US with a southwest to northeast orientation, affording opportunities for warm, moist, unstable air masses moving north out of the Gulf of Mexico, in a similar fashion to this outbreak. Tornadoes in the cold season (November through February) are nearly 50% more likely in La Niña winters than El Niño winters with a greater northern extent, while neutral ENSO winters feature the lowest likelihood of winter tornado occurrence.
Report Sources: Reuters, Freight Waves, CNN, Times Union, New York Times, The Washington Post, Crain’s Chicago Business, The Weather Channel, Associated Press, PowerOutage.US, Clark & Co., U.S. National Weather Service, Insurance Journal, Weather Underground