
Event Headlines
- Largest flood event to occur since 2011 Queensland floods, and one of largest in Australia’s history.
- Worst-affected regions are Lismore (NSW), Ballina (NSW), suburbs around Brisbane River (QLD), and Gympie (QLD).
- The Insurance Council of Australia (ICA) reported 118,106 claims, with estimated insured losses of AUD 1.77 billion.
- The event has placed emphasis on town-planning concepts of resilient rebuild and relocation.
- Climate change likely increased the severity of the rainfall, but it was not responsible for the type of meteorological setup that led to this event.
Meteorological Background
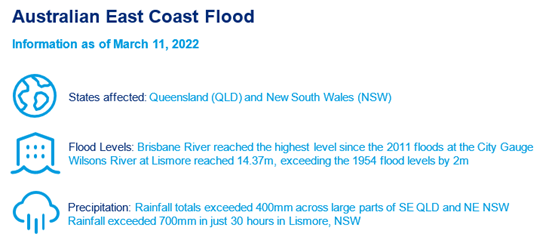
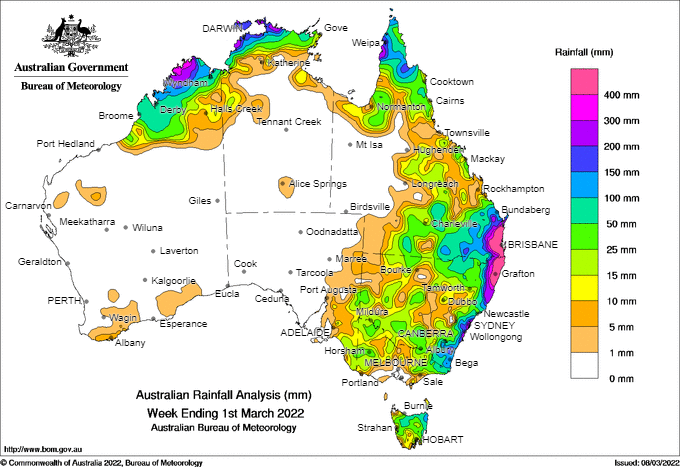
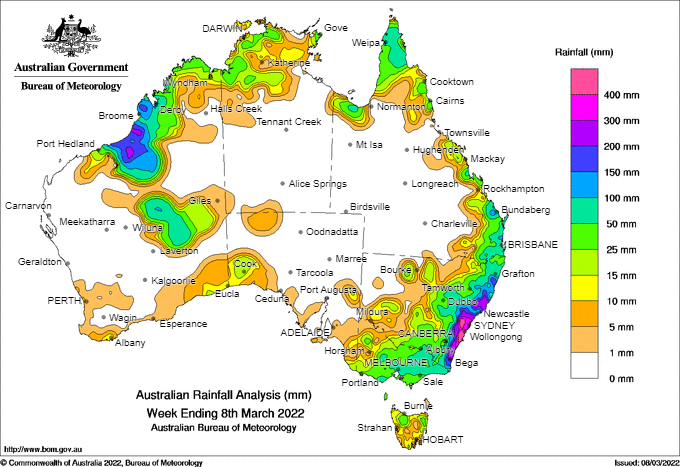
The 2021/22 summer has experienced above average rainfall for the east coast of Australia. According to the Bureau of Meteorology, a La Nina event has been active since November 2021. In this period, the subtropical ridge shifted farther south throughout the summer during a positive Southern Annular Mode. Under the influence of these two climate drivers, tropical air expanded farther down to the southeastern states, increased onshore wind, and brought more moisture to eastern Australia.
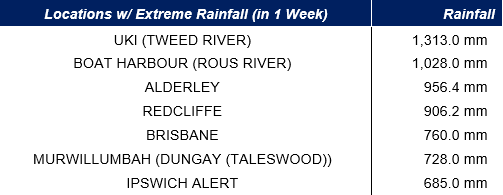
A monsoon trough first developed off the coast of Queensland in late February. The trough drew tropical moisture from the Coral Sea and lifted it over the coast, causing widespread heavy rainfall in SE Queensland and NE New South Wales on February 24. A high pressure system near New Zealand prevented the trough from moving away from the coast, resulting in prolonged and widespread heavy rainfall. Record-breaking rainfall was observed over the Sunshine Coast and coastal areas of SE Queensland leading to severe flooding.
Damage Impacts
Queensland
- The areas with the largest damages were around Brisbane, Gympie, Maryborough and Ipswitch.
- In Gympie, flood waters exceeded the 1999 flood level.
- In Brisbane, the flood waters peaked just below 4 meters at the Brisbane Post Office, which is lower than the 2011 flood level of 4.46 meters.
New South Wales
- The areas with greatest damage were around Lismore, Ballina, Murwillumbah and Grafton.
- The flood levee in Murwillumbah was breached, and river levels surpassed records established in 1974 and 2017.
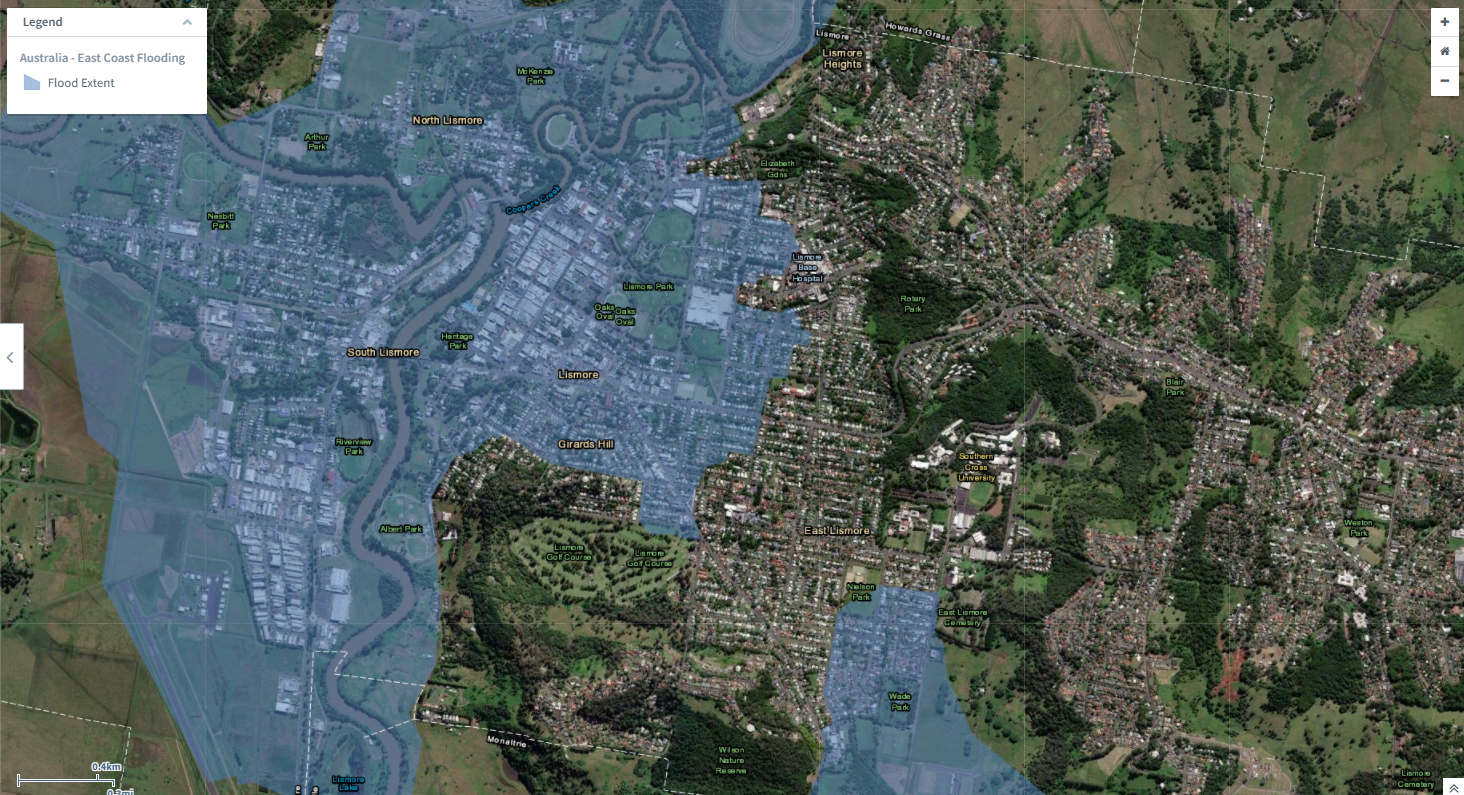
- In Lismore, the floodwaters reached 15.37 meters, which is 2 meters above the highest flood level recorded of 12.27 meters in 1954.
The 2022 February/March East Coast flooding event has been declared a national emergency, with impacts on many areas.
Lives
As of March 5, at least 17 deaths had been reported, 11 from Queensland and 6 from New South Wales.
Property
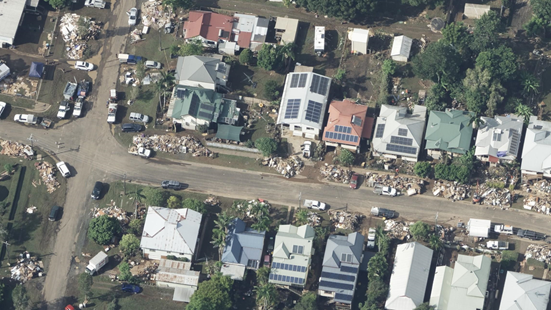
As of March 2, S&P estimated that insured losses could increase to AUD 2 billion with ongoing Brisbane River inundation in urban areas as the storm moved south to New South Wales. As of March 10, the ICA reported 118,016 claims valued at AUD 1.77 billion, with 63 percent of the total from Queensland and the rest from New South Wales, and 81 percent from domestic property, 16 percent from motor vehicles, and 3 percent from commercial properties. The city of Lismore was submerged and 900 homes were deemed uninhabitable out of 1,400 assessed, with up to 3,000 homes affected in total. In Ballina, about 6,000 homes may have been impacted by flood water.
Public Infrastructure
Inundation caused bridge and road closures, making it difficult to deliver relief supplies to victims. Windsor Bridge, North Richmond Bridge, and Yarramundi Bridge were closed. The ferry terminal at Hawthorne by the Brisbane River sustained extensive damage and collapsed. On March 7, Queensland’s State Treasurer, Cameron Dick, estimated that it will cost the state’s economy up to AUD 2.5 billion, with AUD 1 billion spent to repair roads, rail systems, bridges and major infrastructures, and another billion lost in economic activity for the state.
Agriculture
Australia’s largest milk cooperative, Norco, suffered damage to its head office and an ice-cream factory, with many dairy farms and stores inundated with flood water, resulting in damage to livestock, fences, pastures, machinery, and homes. At least 200,000 litres of milk had to be discarded.
According to one estimate, up to 475,000 cattle, approximately 2 percent of the national herd, may have been lost. Some were washed away by strong flood currents or drowned. Numerous dead livestock, including cows and sheep, were seen along the coastline of the Gold Coast.
Crop damage in the region was reported by farmers for macadamias, blueberries, bananas, and avocados.
Public Health Concerns
Public health officials are monitoring the incidence of tetanus, mosquito-borne Japanese encephalitis, diarrheal diseases, and increased respiratory illnesses due to the breeding of dust mites and mold in damp buildings.
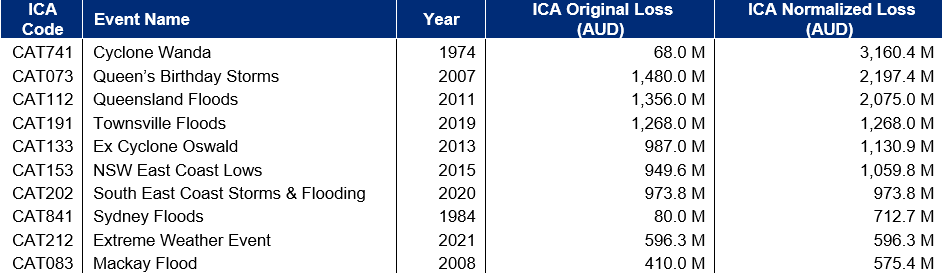
Large Insured Losses
The table below shows original and normalized loss amounts from large historical flood events. According to the latest ICA estimates, the current event ranks among the largest based on insured losses.
Since the 2011 Queensland floods, legislation has provided a standard definition of flood. Many insurers include flood cover as an integral part of a household policy, whereas some allow policyholders to opt out, cover flood at a much lower limit, or do not cover it at all. A licensable National Flood Information Database (NFID) with 11.3 million property addresses is available to help determine flood risk for individual properties. These developments have increased flood insurance penetration. One research paper reported that only about half of home and contents insurance policies included flood cover in 2011, whereas the current covered proportion is around 90 percent. Thus, the current event’s insured losses may be higher than for similar previous events. However, in disaster-prone areas, flood premiums are deemed too high by some residents, so covered proportions may be lower. Furthermore, the ICA estimates that 23 percent of Australian households do not have building or contents insurance, meaning that approximately 1.8 million residential households are not protected. There are ongoing discussions about including non-cyclonic floods in the newly proposed Government Cyclone Reinsurance Pool. This event also has placed an emphasis on considerations for resilient rebuild, or even relocation, for areas that have been flooded repeatedly.
Climate Impacts
Prolonged and intense rainfall led to the flooding in southeast Queensland and northeast New South Wales. There is evidence climate change is increasing the intensity of extreme rainfall globally and regional climate models project flooding will increase in Brisbane and surrounding areas. However, the prolonged nature of the rainfall in this event was caused by a meteorological phenomenon known as blocking, in which high pressure remains in place for an extended period, and there has been limited scientific research on whether climate change influences the frequency of blocking for Australian East Coast Lows. Climate change may have increased the severity of the rainfall, but it was not responsible for the type of meteorological setup that led to this event.
Guy Carpenter has developed inland flood model solutions to inform clients of their potential future risk from flooding under different time horizons and warming levels.
Sources: Bureau of Meteorology, National Road Transport Association, Insurance Council of Australia, Australian Broadcasting Company, Sydney Morning Herald, The Guardian, Defence Service Homes, S&P Global, AXCO, PERILS