
Event Headlines
- Hurricane Ian made landfall as a high-end Category-4 hurricane in southwest Florida on September 28 at 3:05 PM EDT, according to the National Hurricane Center (NHC), with maximum sustained winds of 150 mph. Ian made a final landfall on September 30 near Georgetown, South Carolina around 2:05 PM EDT as a mid-range Category-1 hurricane.
- The storm moved ashore near Captiva Island in Charlotte County, FL after several periods of rapid intensification, tying for the fifth strongest landfalling continental US hurricane on record.
- Media reports indicate at least 104 fatalities, and this number could well increase as assessment efforts continue. In the most severely affected areas of southwest Florida, numerous homes and businesses have been completely destroyed along with most support infrastructure.
- Initial publicly available insured loss estimates suggest that Hurricane Ian will be one of the costliest hurricanes to the insurance industry on record.
The Hurricane Ian CAT Resource Center post event report, available via PDF download details the following aspects of the storm which are highlighted in summary below.
- Regional Impacts
- Notable Impacts by Sector
- Initial Insured Loss Estimates
- Implications for the Insurance Industry
- Key Dates in the Timeline of Hurricane Ian
- Physical Discussion of Hurricane Ian & Meteorological Statistics
Regional Impacts
The state of Florida was most severely impacted by Hurricane Ian. The Ian Post Event Report details impacts across multiple regions of Florida as well as the Carolinas. An in-depth discussion of impacts to the southwest, central and northeast regions of Florida, as well as further north into the Carolinas and the Mid-Atlantic, is included within the full report.
Notable Impacts by Sector
The full post event report provides a detailed assessment of many sectors impacted by the category 4 landfall of Hurricane Ian. Implications for offshore energy interests, power outages and infrastructure damage, supply chains and transportation interests, and agriculture and livestock industry impacts are highlighted.
Implications for the Insurance Industry
In addition to detailing the recovery required for notable sectors mentioned above, the post event report details several other key implications for the insurance industry. The determination of wind vs. water as a source of loss, extended business interruption and additional living expense claims due to infrastructure destruction and the prolonged recovery for highly devastated regions are chronicled. Sources of elevated loss outcomes are also discussed, including ingress/egress issues, pervasive mold damage, inflationary pressures, assignment of benefits and implications for rebuilding to current building codes.
Physical Discussion
On September 23, NHC issued the first public advisory on Tropical Depression 9, which eventually became Hurricane Ian, 8 days before the last public advisory from the NHC was delivered late on October 1. During this period, Hurricane Ian spent 4.25 days as a hurricane, 2 days as a major hurricane, underwent rapid intensification (greater than 35 mph intensity increase in 24 hours or less) twice, and made three hurricane landfalls (Cuba, Florida, South Carolina). During Ian’s lifecycle, there were several important physical processes that are highlighted in the report:
- Cyclogenesis over the Caribbean
- Rapid Intensification before Cuba and landfall
- Rapid Intensification before Florida and landfall
- Re-Intensification after Florida and final landfall in South Carolina.
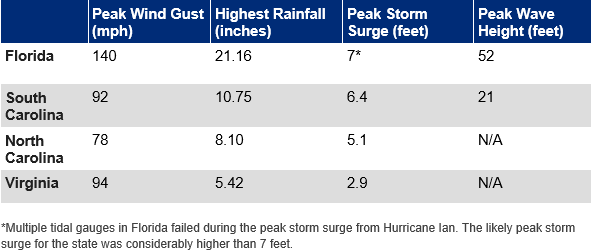
- Historic storm surge
- Significant inland flooding due to excessive rainfall
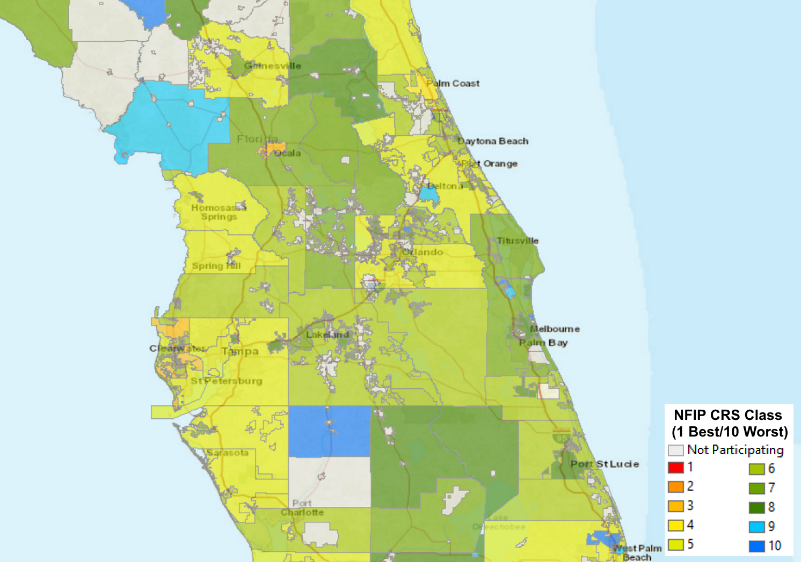
- Aspects of community resilience efforts for major hurricanes and excessive rainfall
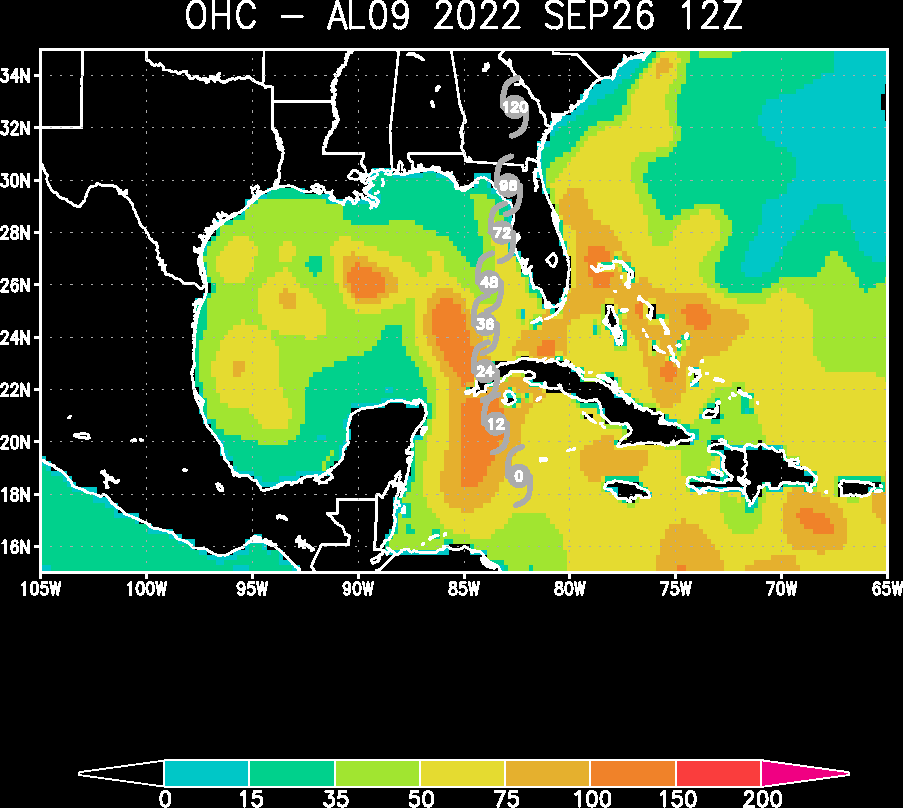
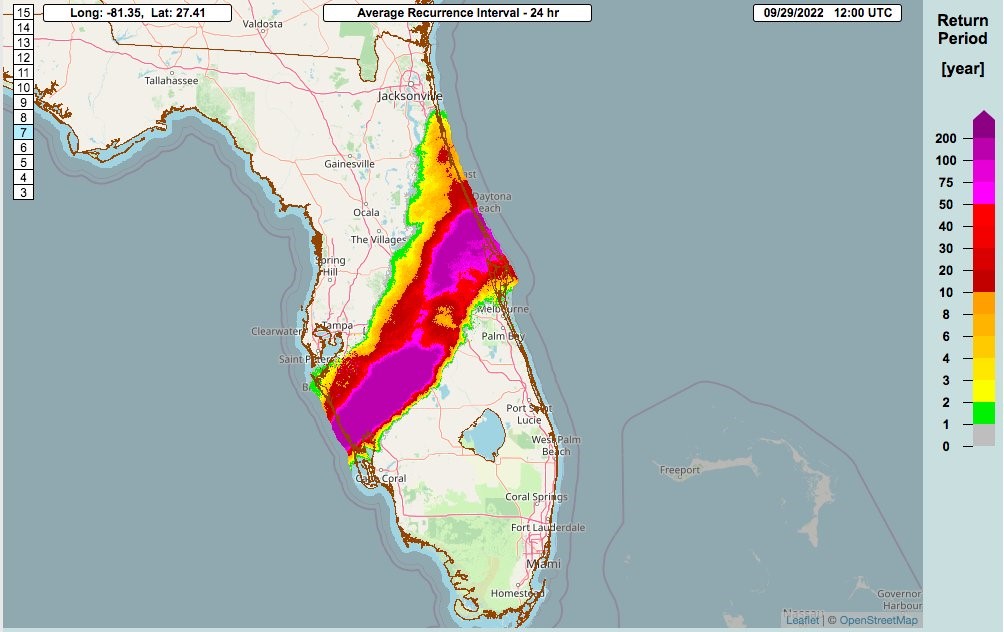
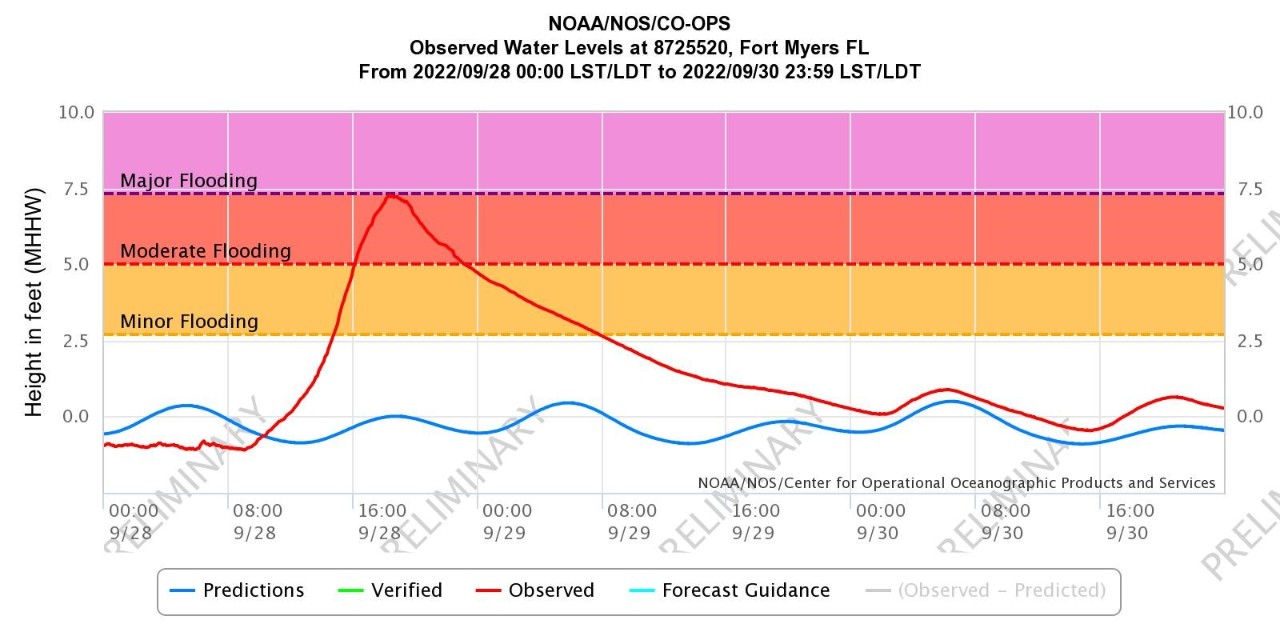
 Source: NWS, NOAA, CERA, Guy Carpenter.
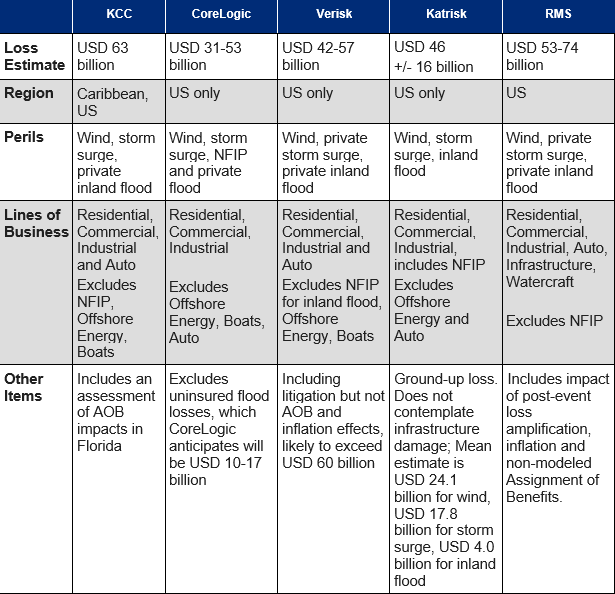
Insured loss estimates (USD). Sources: Verisk, Katrisk, CoreLogic, Karen Clark & Co., RMS and The Insurer.