
As companies encounter challenges finding capacity in today’s (re)insurance market, parametric risk transfer is gaining interest. Some parametric earthquake solutions have come to rely on a product called ShakeMap®, developed by the US Geological Survey (USGS). This article addresses factors that companies need to consider when choosing whether to use a ShakeMap-based or a more traditional cat-in-a-box transaction.
Two Dominant Types of Parametric Earthquake Transactions
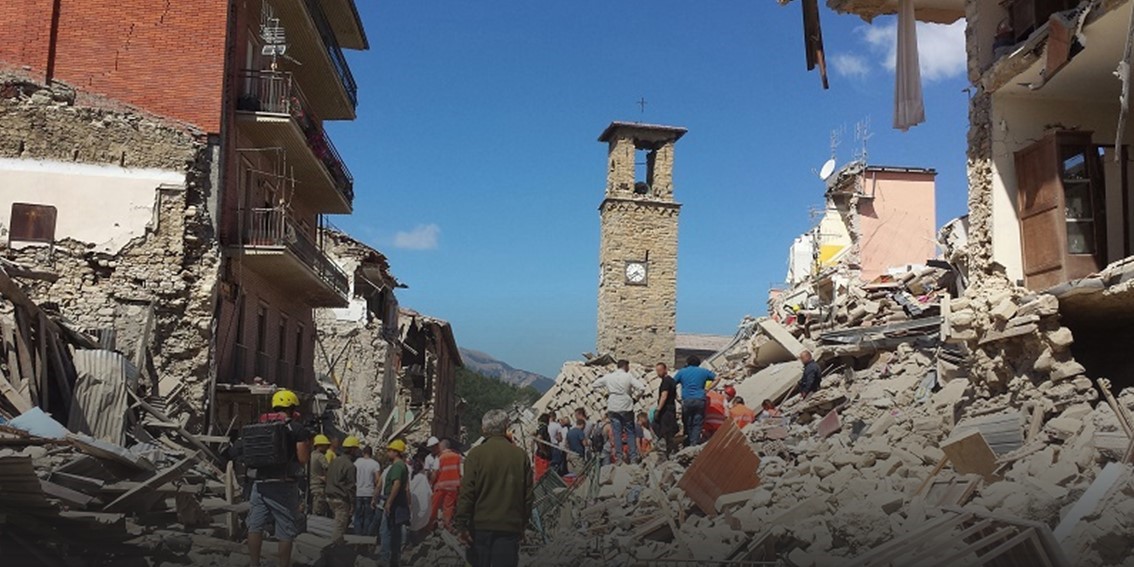
Earthquake parametric solutions were first used in the placement of the Parametric Re catastrophe bond in 1997, and they continue to evolve. Parametric solutions were designed to eliminate the traditional claims adjustment process, which relies on an assessment of actual damages by a surveyor or claims specialist and which may take months or years to complete. In contrast, recoveries provided by a parametric mechanism can be accessed within weeks of the event and without dispute. This feature makes parametric solutions appealing when speed of payment and transparency are priorities.
Today, there are mainly two classes of earthquake parametric solutions in use. The first class uses the fundamental parameters of the earthquake event, which typically include its epicentral location, focal depth and magnitude. These describe where the earthquake originated and how much energy it released. While these values serve only as proxies of loss, they are simple to understand and readily published with transparency by the USGS in a matter of minutes after the earthquake occurs.
This type of transaction is referred to as first generation or cat-in-a-box because it uses polygons, zones or “boxes” to identify whether an event triggers a payout depending on its location. Over the past 2 decades, cat-in-a-box solutions have improved in their accuracy with the implementation of high-resolution, 3-dimensional grids (sometimes also known as “cat-in-a-grid”) to classify events better, minimize basis risk, and maintain simplicity and transparency. 1
Transactions sponsored by governments—such as those related to the Mexican catastrophe bond series placed between 2006 and 2020 or the 2018 USD 1.36 billion limit Pacific Alliance transaction—have used this approach, mostly because the exposures used to calibrate these transactions were approximate and vast, and transparency and simplicity in calculating recoveries were desirable factors.
The other dominant class of parametric earthquake transactions uses local ground-motion intensity measurements at particular geographical locations to determine payouts. These transactions are sometimes referred to as second-generation or ground-motion indices.2 In their purest form, these solutions use networks of actual seismometers. Sometimes, they use a particular instrumental station located in the proximity of the covered assets. In other instances, they sometimes use numerous stations aiming to capture large swaths of ground-motion patterns over an extensive territory. The 2008 Muteki Ltd. and 2012 Kibou Ltd. catastrophe bond transactions, for instance, relied on more than 1,000 K-Net and Kik-Net network instruments in Japan to determine ground-motion intensity. Muteki produced a full payout after the Tohoku earthquake in 2011.
1. See e.g., Franco (2010, 2013), Franco et al. (2018, 2019), Guidotti et al. (2022), Bayliss et al. (2020).
2. See the classification of methods in Wald and Franco (2017).
Which Type is Better?
Although second-generation solutions based on ground motions are not devoid of challenges, there is industry consensus that they can minimize basis risk more effectively than cat-in-a-box transactions, which use only 4 numbers to approximate a loss, whereas a groundmotion index can potentially use more than a thousand parameters, as Muteki or Kibou did.
Unfortunately, rigorous numeric studies that compare first-generation and second-generation solutions are scarce. We know of only a few works that aimed to quantify their performance, mostly spearheaded by Professor Katsuhiro Goda, now at Western University in Canada. In his 2013 work, he concluded that cat-in-a-box transactions would perform worse than ground-motion indices if the ground motions were somewhat correlated. However, this conclusion was reversed in the limit case of uncorrelated ground motions. In a follow-up study in 2019, which compared an intensity-based tsunami index with a cat-in-a-box approach, the errors estimated by the authors were in the order of 3% to 4% for the best intensity indices versus 8% to 10% for the cat-in-a-box method. Consistent error estimations (4% to 7% for the intensity indices versus 9% to 12% for the cat-in-a-box option) are presented in a more recent 2021 study, in which it is acknowledged that whereas cat-in-a-box methods are simpler and universally applicable around the world, intensity indices require monitoring systems, which are only available in specific countries, such as in Japan, where the study was conducted.
These studies, limited as they are, support our general intuition that indices using many parameters can better minimize basis risk than cat-in-a-box transactions that use only 4 parameters. However, they also suggest that the differences are not very significant. In the first study, there were cases under which cat-in-a-box solutions were actually better and, in the others, the error differential was relatively small.
Use of USGS ShakeMap for Parametric Earthquake Transactions
This article addresses factors that companies need to consider when choosing whether to use a ShakeMap-based or a more traditional cat-in-a-box transaction.
The Scarcity of Data Sources for Intensity-Based Approaches
Very few countries have instrumental networks comparable to Japan’s. Some parts of the US are thoroughly instrumented, as are the cities of Istanbul or Mexico City. However, in general, instrumental networks that provide their measurements openly, rapidly and transparently through the internet, such as K-Net, are scarce. This limits the range of applicability of this second class of earthquake parametric solutions to just a handful of regions.
To circumvent this problem, some parametric solutions in the market aim to substitute the usage of an actual instrumental network with ShakeMap,3 which provides a ground-motion footprint after an event, portraying the distribution and severity of the shaking. This useful tool supports the insurance industry and is a critical resource for the engineering and emergency-response communities.
However, USGS ShakeMap does not reflect the actual distribution of shaking intensity after an event and is not equivalent to an instrumental network. ShakeMap is “a model of intensity of a model of an earthquake” as Dr. David Wald and colleagues, creators of ShakeMap, wrote in their recent 2022 paper.
3. See a full description of ShakeMap in Worden et al. (2020)
How Does ShakeMap Work?
ShakeMap is a representation of ground motion caused by an earthquake, generated by a ground-motion model, similar to those used by catastrophe modeling companies such as Verisk or Risk Management Solutions (RMS), to estimate damages from simulated earthquakes. The underlying model that ShakeMap uses to calculate ground motions is maintained by the USGS and aims to perform at the highest levels of scientific advancement and consensus.
To produce a ground-motion footprint, ShakeMap first requires the fundamental parameters of the event (the same used in cat-in-a-box parametric solutions), and, if known, the fault geometry. ShakeMap then produces a field of median ground motions conditioned on the instrumental and macroseismic data available.
The first set of data is acquired from instruments that measure ground motions in the field, which are not densely distributed everywhere. The second set of data is obtained from users of the USGS “Did You Feel It?” (DYFI) system, a website that allows the public to enter qualitative descriptions (type of building, level of shaking, for example) of the effects experienced in the earthquake. These responses are then translated into a quantitative estimate, specifically, Modified Mercalli Intensities (MMI).
ShakeMap uses a very sophisticated “interpolation” process, employing a ground-motion model to fill the gaps between measurements and observations. Depending on the data available for a given earthquake and for a given location, ShakeMap’s ground-motion footprints may then rely more on its underlying model, instrumental data or on user-provided observations.4
4. See Appendix to determine what regions are better suited for ShakeMap-based indices.
Key Recommendations
- Consider the numerical evidence: Although we intuitively know that ground-motion indices such as those based on ShakeMap have the potential to minimize basis risk more effectively than cat-in-a-box transactions, differences published thus far have been shown to be relatively small. Where possible, clients should request comparative analyses with the two approaches.
- Consider the exposures and coverage: Are they appropriate for parametric risk transfer? Covers for dispersed portfolios containing poorly described assets tend to be better candidates for parametric solutions. Covers that require a high degree of precision for a small number of assets (as is the case in personal insurance) generally may not be good candidates for parametric risk transfer.
- Consider the level of complexity tolerated: If a client is new to the use of parametric solutions or if the solution requires a wide range of stakeholders to reach comfort, a simpler approach, even if potentially less precise, may be a better option.
- Consider the peril: Some solutions, such as ground-motion indices or ShakeMap, will be appropriate to capture shaking damage, but are not well suited to capture secondary perils such as tsunami damage.
- Consider the geography: Is the ground-motion modeling of good quality for the region in question? Is the network of existing seismometers dense? The uncertainty in ground-motion estimates depends on these factors. Consult this article’s Appendix to learn how to make an informed decision.
- Mitigate uncertainty: Clients should consider using a dense grid of calculation points or virtual stations, so that any uncertainty is “spread out” in the region considered. Index formulations that rely on many geographically distributed estimates are more stable. 5
- Consider the litigious environment and need for transparency: From a scientific perspective, use of the USGS’ DYFI information in ShakeMap is a clever, resourceful use of witnesses as “human sensors.” However, it opens a door to questions and—unlikely as it may be—possible manipulation. Clients might consider using a ShakeMap version free of macroseismic observations (using only instrumental data) in the response protocol of the trigger, so that external human agents do not become part of the process.
- Establish a clear protocol of data usage: The USGS and various associated agencies create an array of ShakeMap versions as an event unfolds (within a few hours parameters are stable, within 72 hours fault model is stable)6, aiming to refine the ground-motion estimates as they deem necessary. Companies should ensure that the triggering protocol for a ShakeMap-based solution clearly describes what version of ShakeMap is to be used, within what timeline, and under what circumstances, so that there is no confusion as to the final parameters’ values relevant to the transaction. In that regard, the USGS provides for each ShakeMap complete, permanently archived metadata that will allow the user to recover/regenerate each ShakeMap version of interest.
5. A discussion on the optimal number of stations can be found in the work by Pucciano et al. (2017)
6. Procedures for ShakeMap creation can be found in Worden et al. (2020)
Guy Carpenter Earthquake Parametric Solutions
ShakeMap is useful for communities dealing with earthquake risk as it may relate to building-code design, emergency response or (re)insurance. As our industry strives to construct better parametric solutions and more clients endeavor to explore these tools, we recommend the best practices described in the Key Recommendations section, above.
Guy Carpenter recognizes the significance of identifying the right situations for using ShakeMap or a cat-in-a-box solution. We understand that companies’ needs are diverse, and traditional insurance solutions may not always address them. Our proprietary system to deploy parametric risk transfer solutions for earthquake risks, GC QuakeCube®, delivers:
- Reduction of basis risk. We offer a global parametric earthquake design system that features payment conditions according to a regular, high-resolution, 3-dimensional grid. Optimizing the appropriate magnitude trigger in each grid cell, we capture the risk of our client’s portfolio with greater fidelity.
- Mitigation of model risk. We incorporate techniques to extend trigger conditions in areas where models may lack enough samples to appropriately represent local seismicity. This provides robust solutions less susceptible to shortcomings in risk models or potential errors in reported parameters.
- Efficient design and placement. We offer off-the-shelf solutions, tailored to respond to industrywide losses, so the triggers can be effectively used as an industry loss index on a parametric basis.
- Deployment versatility. We can deploy our parametric solution as insurance-linked securities or (re)insurance, depending on clients’ objectives and requirements.
- Customization. We work with clients to determine the degree of customization necessary, ranging from minor tuning of an industrywide solution to a fully custom-built trigger that specifically captures our clients’ assets.
Use of USGS ShakeMap for Parametric Earthquake Transactions
This article addresses factors that companies need to consider when choosing whether to use a ShakeMapbased or a more traditional cat-in-a-box transaction.
Appendix: Additional Insights and Considerations
As new information related to an earthquake reaches the USGS, scientists managing the creation of ShakeMap outputs may decide to regenerate the ground-motion footprints. It is common that a particular earthquake event may be followed by multiple versions of ShakeMap results. The USGS aims to provide guidance as to which is the preferred version of a generated ShakeMap footprint at any given time, but sometimes there are challenges in this assessment, as different maps may be produced by different entities within the USGS ecosystem at different times in the pursuit of different objectives. Multiple versions of ShakeMap outputs are the consequence of the significant uncertainties in the process of creating these maps. In this Appendix, we provide guidance to understand the main sources of these uncertainties and how to judge their impact on parametric earthquake risk transactions.
Can ShakeMap Be Used for Parametric Transactions Everywhere?
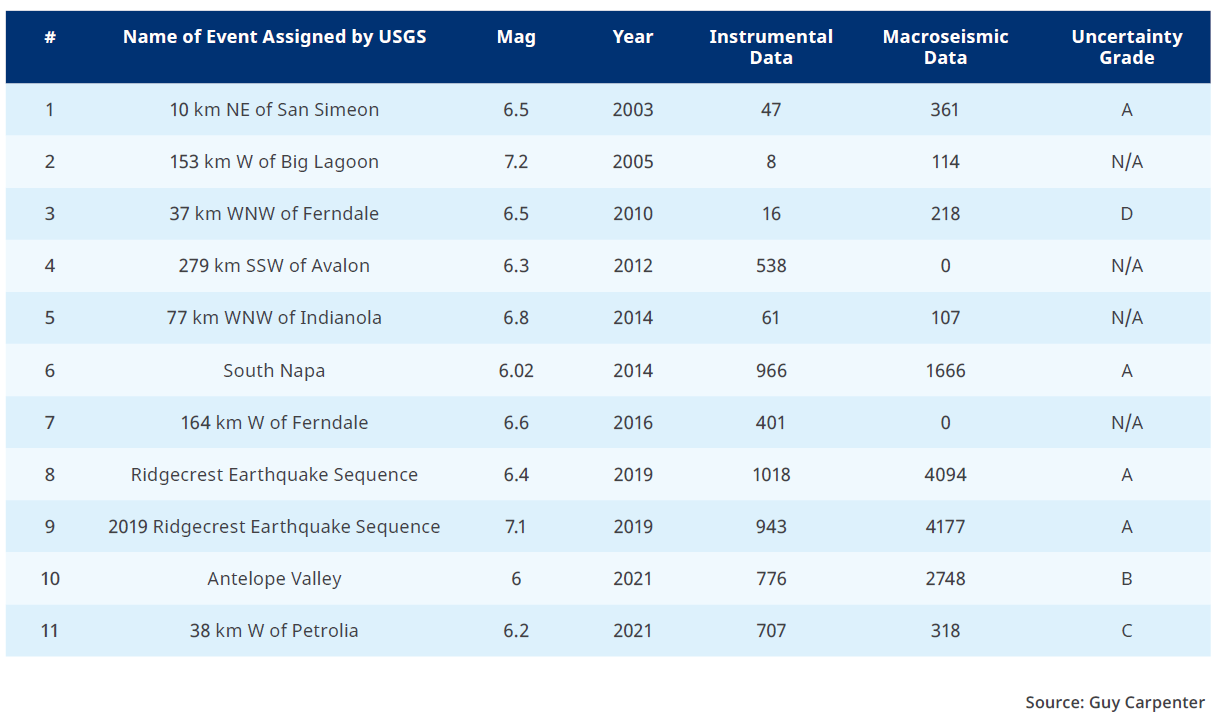
To obtain a perspective on the data sources available for ShakeMap for different parts of the world, one can sift through the USGS ShakeMap databases and extract the number of instrumental and macroseismic observations used to produce each ShakeMap ground-motion footprint. Table 1, for instance, shows these data for all events in California during the past 20 years with a magnitude greater than 6.0. Depending on their location and severity, the number of data points varies considerably. For example, the ShakeMap output for the 2010 M6.5 event near Ferndale (#3) was informed by only 16 instrumental measurements and 218 macroseismic observations provided by the DYFI system. In contrast, the ShakeMap footprint for the 2019 M6.4 event of the Ridgecrest earthquake sequence (#8) of similar magnitude used 1,018 instrumental measurements and 4,094 macroseismic reports. The ShakeMap produced for event #3 might be closer to a modeled ground-motion footprint than the one for event #8, which might have been closer to an actual instrumental ground-motion perspective. In addition, as years have passed, instrumentation has improved in California over time, so it is no surprise that more observations are present in later ShakeMap footprints.
Table 1: Earthquakes in California during the last 20 years with a magnitude greater than 6.0. (Click image below for larger version of chart.)
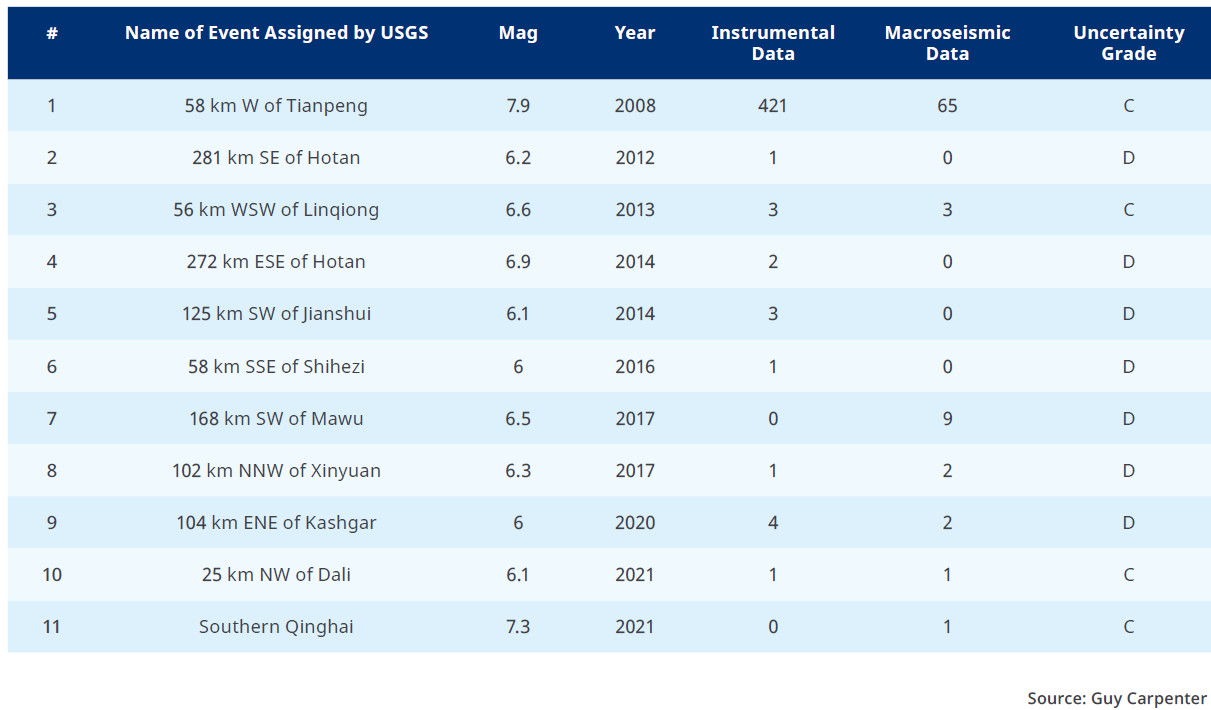
California is a highly instrumented earthquake region. But what if the client’s exposures were, for example, in China? If we repeat the exercise and extract all earthquakes in the USGS ShakeMap database recorded in China during the past 20 years with a magnitude greater than 6.0, we see that the pattern shown in Table 2 is strikingly different from the one for California. In China, very few instrumental and macroseismic observations were available, even for very recent events. With the exception of the 2008 M7.9 Sichuan earthquake, for which 421 instrumental measurements were used, data points characterizing events range between 0 and 4.
While ShakeMap can, in principle, be used globally, it simply tends to provide a modeled view of ground motion in territories where instrumental and macroseismic observations are scarce. Identifying the sources of data that were used to produce different ShakeMap footprints should help ascertain which uncertainties might affect the basis risk of the transaction in a particular region of the world.
Table 2: Earthquakes in China during the last 20 years with a magnitude greater than 6.0. (Click image below for larger version of chart.)
Uncertainties and Non-Uniqueness
Regions with scarcity of instrumental and macroseismic data are more exposed to the full brunt of uncertainty, as there is no other data with which to constrain the model results. Ideally, this requires a more intimate knowledge of the model and its validation. While the industry is somewhat familiar with the behavior of models from Verisk, RMS and other providers—and spends significant resources studying these models—the same does not always apply to USGS models.
As the ShakeMap creators note in their publications, the ground-motion model (GMM) at the foundation of ShakeMap is, in reality, an elaborate ensemble of often-competing GMMs that reflect each region’s seismic setting. As regional GMMs are often inferred from instrumental seismic data, we should expect that regions with limited availability of measurement stations will also display larger uncertainty in their GMMs. In addition, even in regions with dense arrays of seismic stations, it is often difficult to record large magnitude events in proximity to their source fault, which increases the uncertainty of GMMs in the magnitude-distance range of greatest interest for risk management applications.
In deriving intensity measures at any location, numerous sources of uncertainty need to be considered, arising, for instance, from the number of nearby ground-motion observations or from the characterization of the ground-motion model. Uncertainty is exacerbated by the adoption of initial, rapidly determined and unconstrained source parameters to meet the demand for speed. Wald et al. showed in 2008 that the greatest uncertainties are associated with large events with unconstrained source parameters, particularly the fault geometry: if the “distance” term in the GMMs is uncertain, then large uncertainties ensue, unless a very dense network of ground-motion observations is available for that specific area.
It is also important to emphasize that uncertainty is a spatially and frequency-dependent quantity depending on the distance from the source, the presence of nearby ground-motion observations and the intensity measure (IM) of interest. As a result, in addition to the maps of IMs of interest, ShakeMap produces uncertainty maps, which provide for each IM a quantitative assessment of uncertainty at any geographic location of interest.
To qualify such uncertainty in a simpler, qualitative way, Wald and colleagues introduced a grading scale, from A (high quality) to F (poor quality). The scale allows the user to quickly ascertain the appropriate level of confidence when using ShakeMaps. Lower grades (D and F) correspond to medium or large events where source parameters are not constrained, mid-grade C indicates moderate events that could be fairly represented with a point-source location, and higher grades (A and B) indicate medium/large events with constrained source parameters and numerous ground-motion observations available.
Looking at the examples in Tables 1 and 2, we can observe that 5 out of 7 events in California for which a grade is available reach a high grade of A or B. This suggests that constrained source parameters and a large number of seismic and macroseismic observations are available for those events. Consequently, ShakeMaps can be used with a high degree of confidence in most of California.
Conversely, looking at the uncertainty grades in Table 2, none of the events in China reach a high grade, with 7 out of 11 events having a low D grade. This suggests that those events have unconstrained source parameters and ShakeMap may not have enough strong motion observations to be used with high confidence in China.
Macroseismic Observations & Moral Hazard
In addition to instrumental data, ShakeMap uses observed macroseismic intensity data through the DYFI system. This system is helpful in filling gaps where ground-motion recordings are not available and often provides the only control points in sparsely instrumented areas.
As mentioned by Wald et al. in their 2011 paper, the system presents challenges and limitations due to the voluntary nature of the questionnaires, as well as the internet environment, which can be prone to genuine errors as well as intentional wrongdoing. When linking possibly large monetary recoveries to attaining or exceeding a given threshold in a parametric transaction, particular attention must be given to any possible source of moral hazard.
The USGS has implemented automated protocols to promptly and efficiently identify and discard outliers and suspicious reports from the DYFI system. Nevertheless, users of ShakeMap as a triggering mechanism for parametric transactions should be aware of this vulnerability, which can jeopardize well-known benefits of parametric transactions such as transparency and reduced potential for disputes.
As an alternative, it is worthwhile mentioning that the USGS is open to producing ShakeMap outputs without the use of macroseismic information. As we have discussed, this would make ShakeMap behave more closely to a modeled trigger mechanism. However, this additional uncertainty and basis risk may be the cost of a reduced exposure to moral hazard.
Contacts
Guillermo Franco, Ph.D.
Global Head of Catastrophe Risk Research
Guillermo.E.Franco@guycarp.com
Roberto Guidotti, Ph.D.
Assistant Vice President, Catatrophe Risk Management
Acknowledgments
Dr. David Wald of the USGS kindly reviewed this article.
Use of USGS ShakeMap for Parametric Earthquake Transactions
This article addresses factors that companies need to consider when choosing whether to use a ShakeMap-based or a more traditional cat-in-a-box transaction.
References
Artemis (1997). https://www.artemis.bm/deal-directory/parametric-re-ltd/
Artemis (2011). https://www.artemis.bm/deal-directory/muteki-ltd/
Artemis (2012). https://www.artemis.bm/deal-directory/kibou-ltd-series-2012-1/
Artemis (2018). https://www.artemis.bm/news/world-bank-hails-investor-appetite-for-historic-1-36bn-cat-bond/
Artemis (2020). https://www.artemis.bm/deal-directory/ibrd-fonden-2020/
Artemis (2021). https://www.artemis.bm/news/acorn-re-parametric-quake-cat-bond-target-475m/
Bayliss, C., Guidotti, R., Estrada-Moreno, A., Franco, G., Juan, A. A. (2020). A biased-randomized algorithm for optimizing efficiency in parametric earthquake (Re) insurance solutions. Computers and Operations Research, 123, 105033.
Franco, G. (2010). Minimization of trigger error in cat-in-a-box parametric earthquake catastrophe bonds with an application to Costa Rica. Earthquake Spectra, 26(4), 983-998.
Franco, G. (2013). Construction of customized payment tables for cat-in-a-box earthquake triggers as a basis risk reduction device. In Proceedings of the International Conference on Structural Safety and Reliability (ICOSSAR) (pp. 5455-62).
Franco, G. (2014). Earthquake mitigation strategies through insurance. Encyclopedia of Earthquake Engineering, 1-18.
Franco, G., Tirabassi, G., Lopeman, M., Wald, D. J., Siembieda, W. J. (2018). Increasing earthquake insurance coverage in California via parametric hedges. In Eleventh US National Conference on Earthquake Engineering.
Franco, G., Guidotti, R., Bayliss, C., Estrada, A., Juan, A. A., Pomonis, A. (2019). Earthquake Financial Protection for Greece: A Parametric Insurance Cover Prototype. In Proceedings, ICONHIC19 (pp. 23-26).
Goda, K. (2013). Basis Risk of Earthquake Catastrophe Bond Trigger Using Scenario-Based versus Station Intensity–Based Approaches: A Case Study for Southwestern British Columbia. Earthquake Spectra, 29(3), 757-775.
Goda, K., Franco, G., Song, J., and Radu, A. (2019). Parametric catastrophe bonds for tsunamis: CAT-in-a-Box trigger and intensity-based index trigger methods. Earthquake Spectra, 35(1), 113-136.
Goda, K. (2021). Multi-hazard parametric catastrophe bond trigger design for subduction earthquakes and tsunamis. Earthquake Spectra, 37(3), 1827-1848.
Guidotti, R., Tsatsis, A. Franco, G., Kourkoulis, R., Gelagoti, F. (2022) Design and implementation of a parametric insurance cover to mitigate earthquake risk of infrastructure systems. In Proceedings, ICONHIC22.
Pucciano, S., Franco, G., and Bazzurro, P. (2017). Loss predictive power of strong motion networks for usage in parametric risk transfer: Istanbul as a case study. Earthquake Spectra, 33(4), 1513-1531.
Wald, D.J., Lin, K.W., & Quitoriano, V. (2008). Quantifying and qualifying USGS ShakeMap uncertainty. U.S. Geological Survey. Open File Report 2008–1238. https://pubs.usgs.gov/of/2008/1238/pdf/OF08-1238_508.pdf
Wald, D.J., Quitoriano, V., Worden, C.B., Hopper, M., and Dewey, J.W. (2011). USGS “Did You Feel It?” internet-based macroseismic intensity maps. Annals of geophysics, 54(6).
Wald, D.J., and Franco, G. (2017). Financial decision-making based on near-real-time earthquake information. In Proceedings of the 16th world conference on earthquake engineering (pp. 1-13). Santiago de Chile, Chile.
Wald, D.J., Worden, C.B., Thompson, E.M., and Hearne, M. (2022). ShakeMap operations, policies, and procedures. Earthquake Spectra, 38(1), 756-777, doi:10.1177/87552930211030298
Worden, C.B., Thompson, E.M., Hearne, M., and Wald, D.J. (2020). ShakeMap Manual Online: technical manual, user’s guide, and software guide, U. S. Geological Survey. http://usgs.github.io/shakemap/. DOI: https://doi.org/10.5066/F7D21VPQ.