

As industries around the globe face growing political, economic, and environmental challenges, the mutual property and casualty insurance industry remains a strong and vital pillar of the economy.
To understand the effects of current market forces on the mutual insurance industry, the National Association of Mutual Insurance Companies (NAMIC) and Guy Carpenter have collaborated to provide prospective risk assessments across a range of realistic scenarios of concern for the industry: increased hurricane severity; elevated severe convective storm activity; a large scale cyber event; inflation; and stagflation. Using its proprietary standardized capital modeling framework tool BenchmaRQ™, Guy Carpenter conducted a simulation of future operating results based on underlying risk distributions, including capital market outcomes, insurance market cycles, attritional and large losses, catastrophic events, and reserve development.
Scenario Testing Our Mutual Future shows how different risk exposures affect financial results, a key mandate for leaders of today’s mutual industry as the focus has shifted from return on capital to return of capital. Managing across sources of risk to minimize the chance of insolvency while simultaneously maximizing policyholder value is the inherent challenge for any mutual insurer.
This report is the second in an annual series between Guy Carpenter and NAMIC.
Scenario Testing Our Mutual Future
FOREWARD
Guy Carpenter and the National Association of Mutual Insurance Companies (NAMIC) are pleased to present the results from our second year of high-level scenario testing for the U.S. property/casualty (P&C) industry. The goal of the NAMIC and Guy Carpenter scenario testing initiative is to arm mutual industry leaders with three views of performance: 1) benchmarking of prospective risk and return profile for their businesses and their peers; 2) quantifying sources of variability in operating performance to support enterprise risk management decisions; and 3) forecasting how five potential adverse operating scenarios could affect absolute and relative performance, including risk of ruin. Gaining a deeper understanding of all three of these dimensions to risk helps better equip mutual leaders to plan for long-term strength and stability.
The market environment in 2022 was defined by uncertainty, with growing geopolitical, climate, and macroeconomic headwinds presenting a wide range of risks for business leaders to navigate. Favorable asset-market conditions over the past decade have provided a tailwind to many mutual insurers and helped offset underwriting losses. Recent actions by the US Federal Reserve in response to rising core inflation have reversed these trends, and mutuals must come to terms with a new reality where capital is more important and ever-rising asset valuations can’t be relied on to drive surplus growth.
Against this backdrop, the pressure on mutual insurers to articulate the impact of systemic risk scenarios in their financial planning continues to grow, driven by both internal and external stakeholders. Understanding how different risk exposures aggregate to affect financial results is a key mandate for the leaders of today’s mutual industry, as the focus has shifted from return on capital to return of capital. Managing across sources of risk to minimize the chance of ruin while simultaneously maximizing policyholder value is the inherent challenge for any mutual insurer. The increasing complexity of our world today requires mutual insurers to leverage new tools to help guide decision-making. We hope you will find the scenario testing analysis one of your valuable resources for helping with planning and enterprise risk management.
In this paper, we outline our methodology and share results from the analysis. This research is expected to provide a realistic assessment of the potential impact of adverse scenarios on profitability and solvency on the industry and company level for every active U.S. P&C statutory entity. 1
The 2022 scenario tests described in the pages that follow focus on 5 potential adverse environments that could be expected to have systemic ripple effects across the entire P&C industry. Year-end data from 2021 was used for the analysis that was performed in 2022 and published in 2023. Each year, NAMIC and Guy Carpenter plan to re-evaluate the market landscape to ensure that the scenarios presented reflect relevant and insightful risks that matter to the mutual industry.

As always, we welcome any feedback from you, our valued reader, on ways we could further enhance this scenario-testing analysis in the future.
EXECUTIVE SUMMARY
Going into 2022, mutual companies comprised 40.3% of the total capital of the US property/casualty insurance industry.
We expected that percentage to decline slightly to 39.8% by the end of 2022 due to stock companies outpacing mutuals in a “baseline” year of performance.2 The higher expected return on capital for stock companies relative to mutuals is driven by higher operating leverage, lower projected expense ratios, and greater focus on higher-margin lines of business. However, this higher expected return on a surplus in an average year hides the potential for downside risk many stock companies assume to achieve those higher returns.
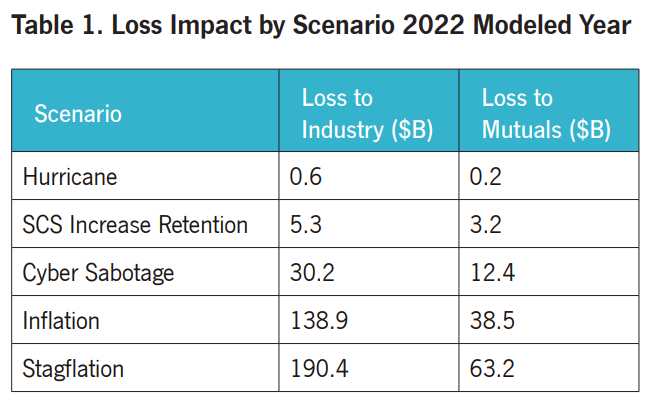
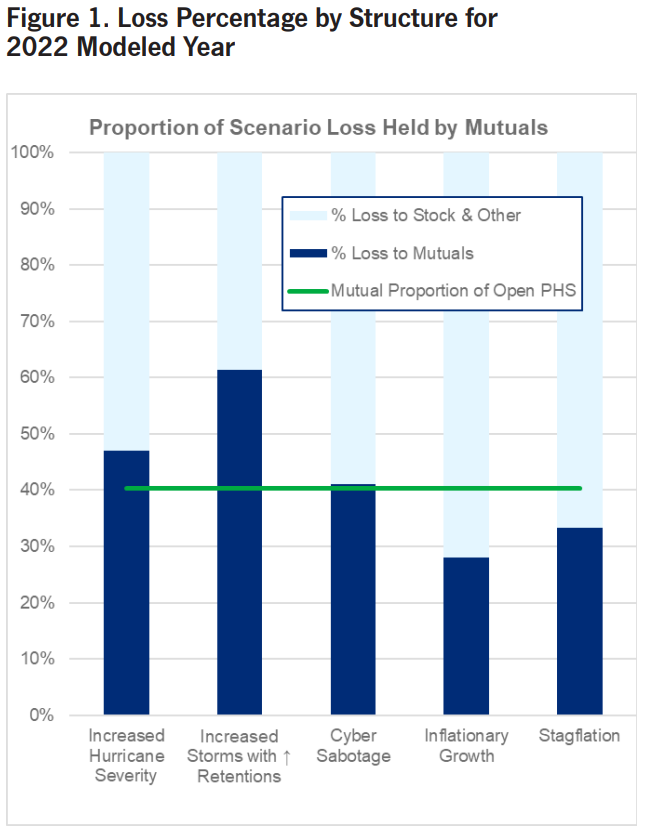 Overall, the mutual industry policyholder surplus (PHS) was expected to grow by 5.3%, with 4.9% of that growth from asset performance and 0.4% from operating performance for the year in our base case. In an adverse operating environment, including any of the scenarios we have selected, the proportion of expected losses absorbed by stock companies versus mutuals can differ materially. We see that mutuals in general are exposed to disproportionately large losses from weather scenarios, which reflect elevated incidents of severe hurricanes and convective storms, resulting in USD 0.2 billion and USD 3.2 billion in net expected annual mutual industry losses, respectively.
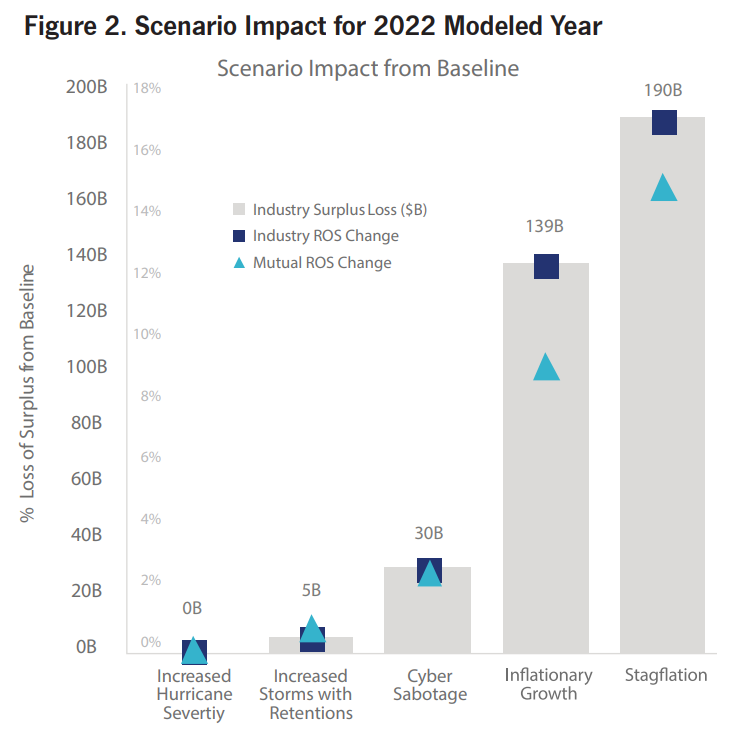
Cyber losses emanating from an industrywide systemic event would be borne proportionally across mutuals and other property/casualty insurers. The two scenarios tested that have the greatest impact on industry surplus are both economic in nature. In inflation and stagflation environments, mutuals are expected to outperform their stock company peers materially, only taking on 27.7% of total losses in the inflation scenario and 33.2% for stagflation.
Stagflation is defined by the World Economic Forum as a period when slow economic growth and joblessness coincide with rising inflation.
Notably from these results we see the mutual industry as a whole defensively positioned for long-term viability through a variety of challenging economic environments.
A notable advantage mutuals enjoy over stock peers is their focus on long-term surplus growth measured using statutory accounting principles (SAP), rather than quarter-to-quarter earnings on a generally accepted accounting principles (GAAP) basis.
We see the mutual industry defensively positioned for long-term viability through a variety of challenging economic environments.
In a rising interest rate environment like what we’ve experienced in 2022, statutory accounting helps to smooth volatility, since bonds that are held to maturity are valued at their amortized cost as opposed to their market value. In accordance with this convention, results presented here are all on a statutory accounting basis. In rising rate environments, mutuals must carefully monitor their liquidity so that assets held to maturity don’t need to be sold at a loss to finance operating deficits. After a strong year of performance for the industry in 2021, the US mutual industry is well capitalized and positioned to survive even extreme scenarios. Our comment in the first year of the analysis was: “The most important takeaway from this research is that as of today, the US property/casualty industry is strongly capitalized, with a large majority of insurance companies well positioned to survive even severe stress.” This observation continues to hold today, even as new risks continue to emerge. Prior year’s baseline projection showed that one in every four companies was expected to lose surplus in the baseline scenario; now, just under 1 in 6 companies is expected to be unprofitable in the 2022 base case.
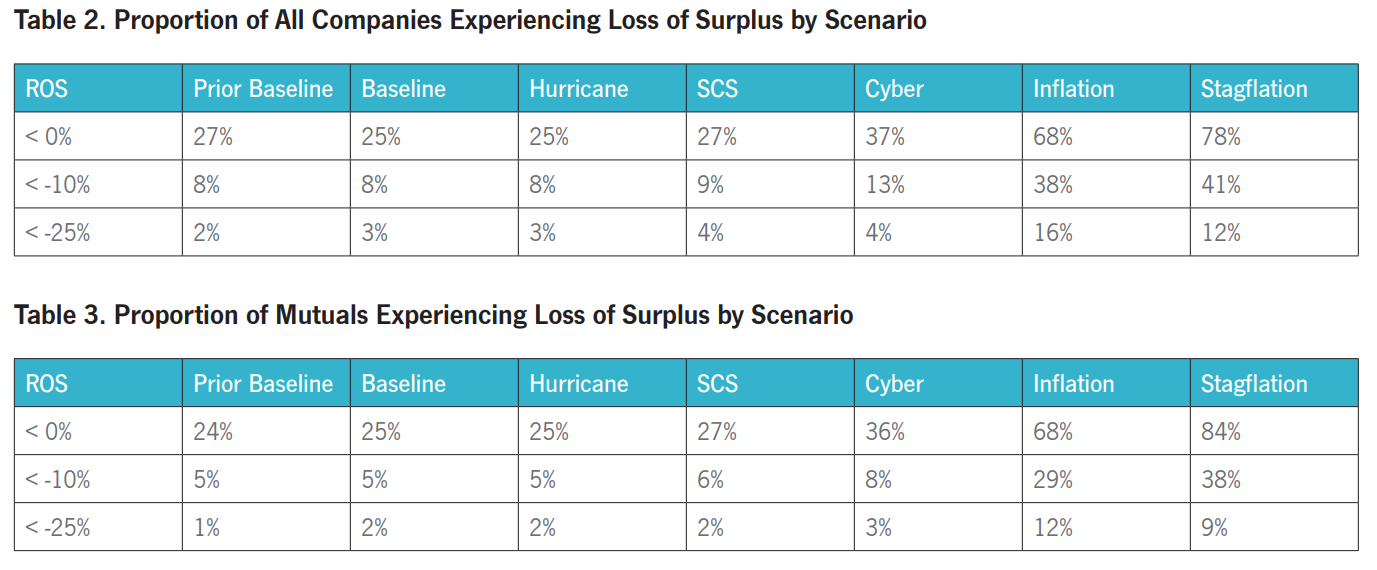
Mutual writers held consistent in their projected performance from 2022 versus 2021, with only 1% increase in mutuals projected to operate at a loss in 2022 versus 2021, versus 2% fewer for the industry at large. In three out of five of the scenarios tested, 92% of companies or more lose less than 10% of surplus. While no company wants to experience a year of near-double-digit loss, this magnitude of loss is expected to represent an earnings event, not a capital event, for all but the most highly leveraged carriers.
The elevated inflation scenario, which projects years of inflation significantly above trend, results in 29% of mutuals losing at least 10% of surplus, but only 12% of companies are expected to experience surplus loss greater than 25%. While inflation does not threaten the operating capital for most mutuals, it does result in almost seven out of 10 mutuals depleting surplus as reserve picks are strengthened in response to higher loss trends. Stock companies are more vulnerable to the inflation scenario, resulting in the ratio of companies losing 10% of surplus across the industry to 38% overall. While 12% of mutuals are expected to lose more than a quarter of their surplus in an inflation scenario, the industry overall could expect to see 16% of companies lose at least 25% of surplus. This further emphasizes the overall strong positioning of the mutual industry to handle large disruptions caused by an inflationary environment.
 Stagflation is the most severe scenario modeled for the industry, driving 12% of all companies and 9% of mutuals specifically to a surplus loss in excess of one-quarter of their capital. Stagflation, which combines three years of increased loss trends with economic contraction, could cause 84% of mutuals to report a decline in surplus, a number greater than the industry overall loss rate of 78%. This increased likelihood of surplus loss is a reflection of a structurally lower return on surplus (ROS) and higher allocation to equity assets for mutual companies.
Interestingly, even in a stagflationary environment where most mutuals are expected to lose surplus, we see that fewer mutuals would be put at risk of inviability or insolvency than would stock companies. At the 10% loss of surplus threshold, 41% of all companies could expect to lose at least one-tenth of their total surplus, compared to only 38% of mutuals. Of all companies, 12% are projected to lose at least a quarter of surplus in this scenario, compared to only 9% for mutuals. Overall, the mutual cohort’s defensive stance provides less expected return in the baseline year but positions companies to handle the outsized stress of a stagflation or inflation scenario with more robustness than the overall industry. As we live in a world of growing uncertainty, the results of these scenarios bodes well for the mutual industry’s ability to persevere despite the range of looming challenges that underwriters face in the years ahead.
The mutual cohort’s defensive stance provides less expected return in the baseline year but positions companies to handle the outsized stress of a stagflation or inflation scenario with more robustness than the industry.
The report provides a blueprint for assessing how different risk exposures affect financial results, a key mandate for leaders of today’s mutual industry as the market focus has shifted from return on capital to return of capital. To learn more, click below to read the full report.