

Seasonal outlook providers are expecting a near-normal North Atlantic hurricane season for 2023. Predictions sit near to slightly below average for the period of elevated activity from 1995-2022, and near to slightly above average for the longer 1950-2022 period. Factors in play include above-average sea-surface temperatures in the Atlantic Main Development Region, and developing El Niño conditions. The ratio of hurricane landfalls to basin activity varies considerably from year to year, and depends strongly on daily weather patterns and related steering currents. Weather prediction for any event generally loses skill beyond a 7-10 day forecast lead. Interests in property (re)insurance should be prepared as always for an impactful hurricane landfall regardless of seasonal outlooks for the basin.
Near-Normal Hurricane Season
Seasonal outlooks for the 2023 North Atlantic Hurricane season are shown in the table below, from:
- National Oceanic and Atmospheric Administration (NOAA)
- North Carolina State University (NCSU)
- Colorado State University (CSU)
- The Weather Company (TWC)
(Click image below to see larger version of the chart.)
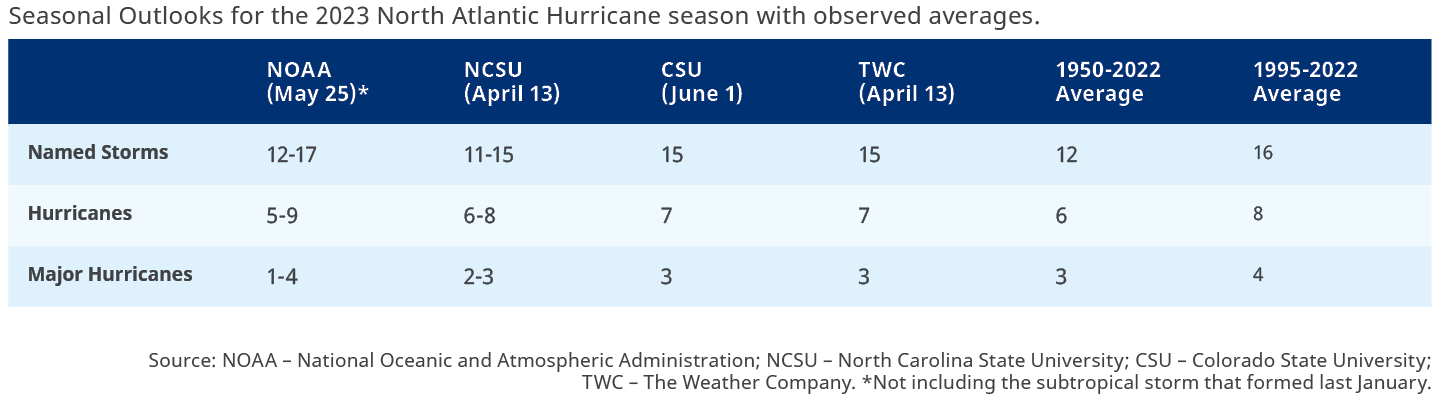
2023 Hurricane Outlook For The North Atlantic Basin
The 1950-2022 average represents a longer-term period where hurricane detection in the Atlantic Basin includes overflight data, and then satellite data from about 1970 onwards. The 1995-2022 average is reflective of the current active period of Atlantic hurricane activity that began around 1995.
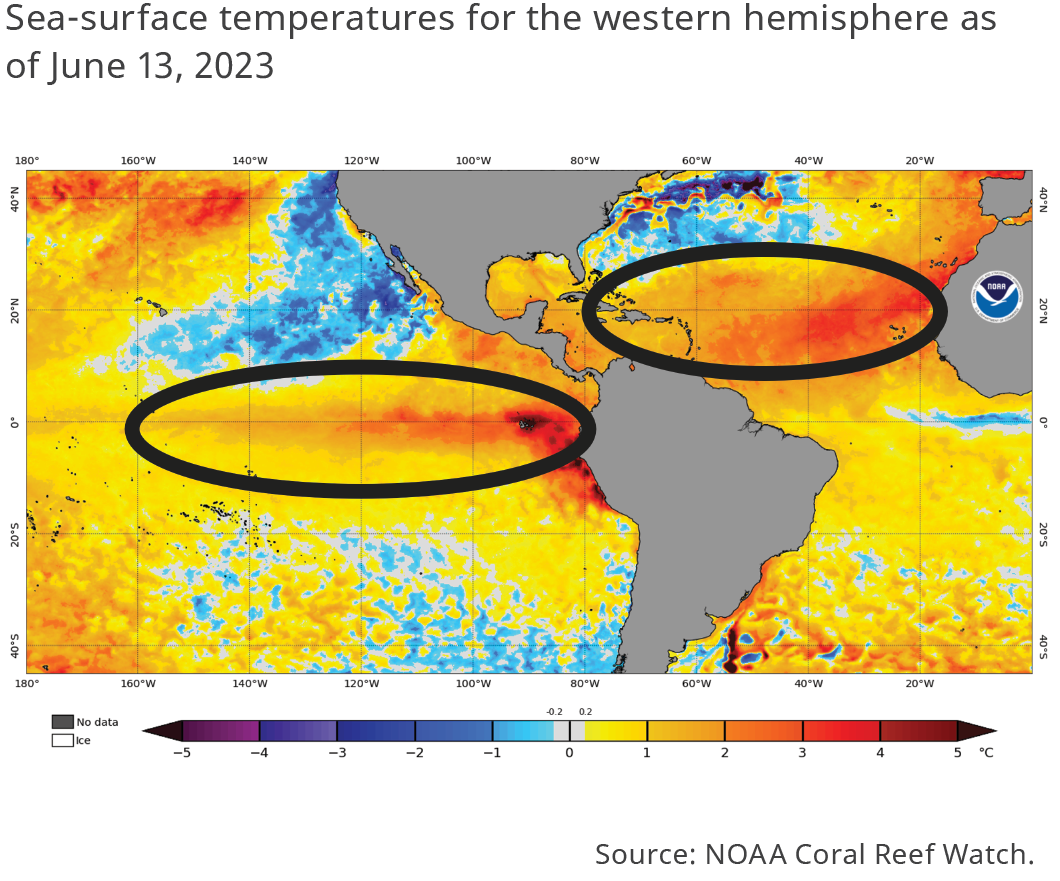
Sea-surface temperatures are trending well above average for much of the Atlantic Main Development Region as shown in the figure below (circled area to the east). With all-else equal, this would be associated with elevated tropical activity in the Atlantic Basin. Elevated sea-surface temperatures in the far west tropical Atlantic and Gulf of Mexico could also enhance the potential for sudden development “in close” to Mainland, including the threat for rapid intensification (sustained wind increase of 35 mph in 24 hours).
In the meantime, the tropical eastern Pacific is becoming warmer than average, consistent with a developing El Niño pattern as shown in the figure below (circled area to the west).
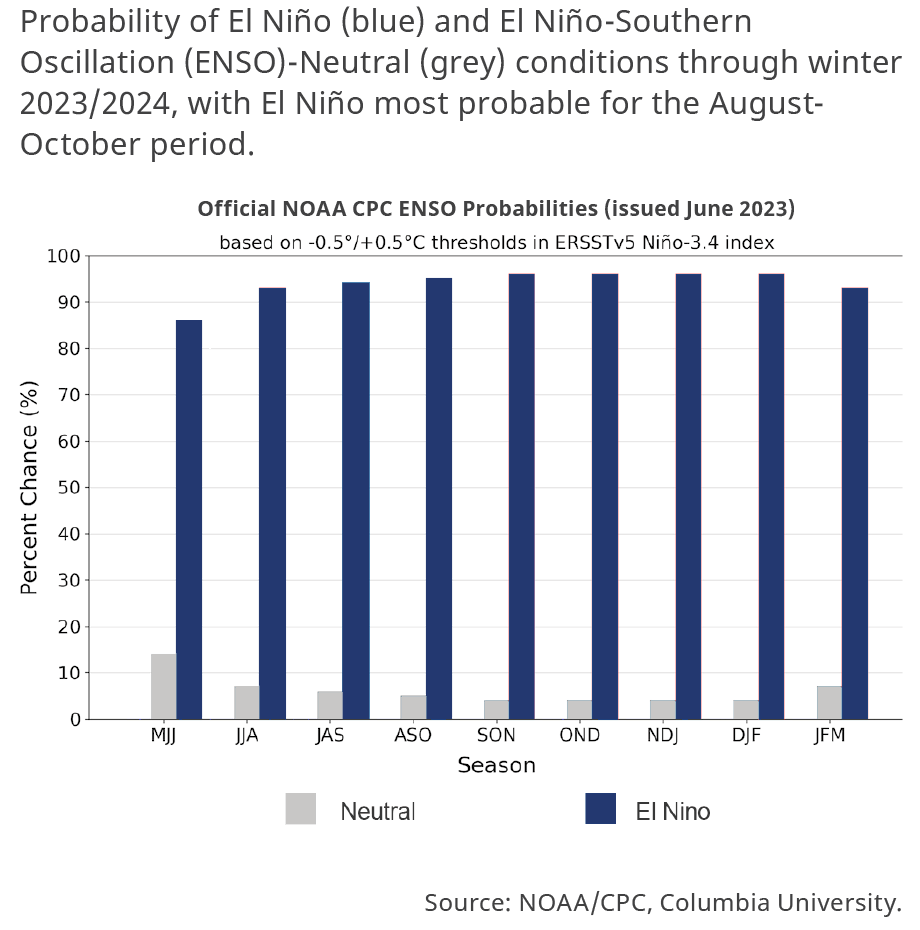
Under El Niño conditions, we typically see reduced hurricane activity in the North Atlantic Basin due to elevated wind shear (change in wind speed with height that disrupts storm development—like a Jenga game on a windy day). For the heart of hurricane season from August to October, El Niño conditions are most probable according to the NOAA Climate Prediction Center, as shown in the figure below. With all-else equal, this would bring reduced activity for the season. The last 3 seasons were La Niña seasons, which are typically associated with elevated hurricane activity.
The competing factors of warm waters in the Atlantic versus the developing El Niño in the Pacific lend more uncertainty than usual to predictions for 2023. Forecast sea-surface temperatures could surpass the warmest of any prior season in recorded history in the Atlantic Basin. In the meantime, the strength and placement of the developing El Niño will be an important factor for Atlantic Hurricane activity in 2023. One factor that could act as a “tie breaker” is the aggressiveness of disturbances leaving the African coast (called “African Easterly Waves”), and their relation to the West African monsoon circulation.
According to the NOAA Climate Prediction Center, the circulation appears weak at present, but model guidance shows this could strengthen over the coming months to produce more aggressive African disturbances. This in turn could lead to more named storms and hurricanes as a result, a factor that will be closely monitored as the season unfolds.
Analog seasons that most closely match expectations for 2023 include 1951, 1957, 1969, 2004 and 2006, according to the seasonal outlook from Dr. Phil Klotzbach of Colorado State University. These seasons either produced very quiet activity (such as occurred in 1951 or 2006) or very impactful activity (such as occurred in 1969 (Camille) or 2004 (Charley, Frances, Ivan, Jeanne)). One of the quietest seasons was 1957, which produced only 3 hurricanes in the Atlantic Basin, but 1 catastrophic landfall and devastating storm surge for the Northern Gulf, with Hurricane Audrey.
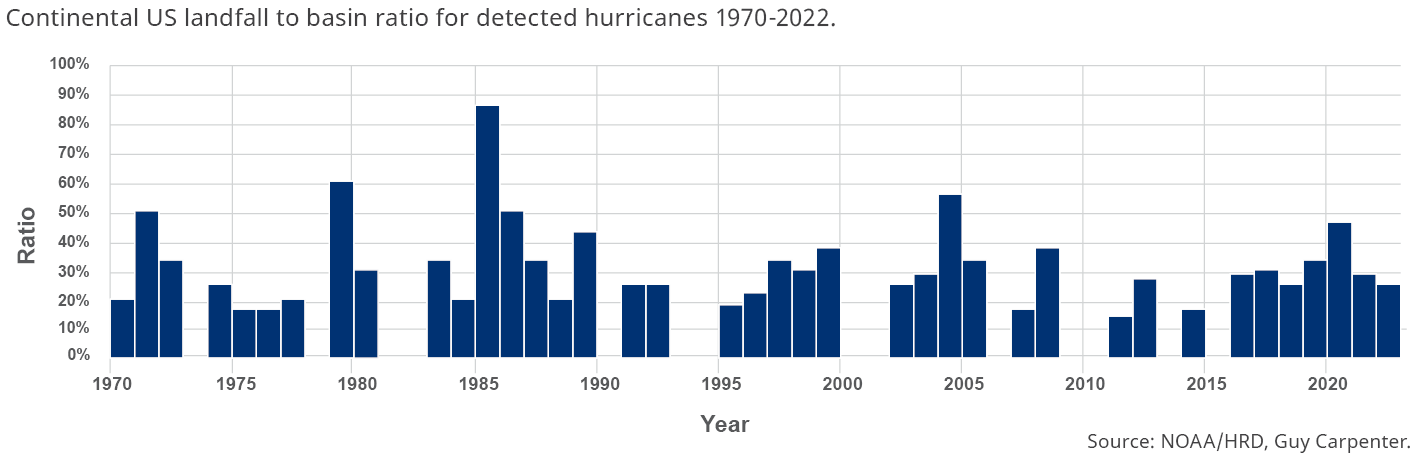
Meanwhile, the Continental US landfall to basin ratio shows considerable volatility on an annual basis. Hurricane landfalls depend on how close the hurricane is to land, along with weather patterns and associated steering currents. Neither of these is reliably predictable on long timescales beyond 7-10 days, and even 72 hours can be a challenge in certain cases. The landfall to basin ratio for the Continental US is shown in the figure below, with a range between 0 and 86 percent for the post-satellite period (and best detection capability).
(Click image below to see larger version of the chart.)
Toward the Most Proactive Event Response
Companies looking to respond faster to catastrophe events, underwrite more profitably and create robust portfolio management strategies can leverage the power of GC AdvantagePoint®, our best-in-class geospatial analytics and exposure management platform. The platform enables users to be more proactive in their event response protocols, enabling them to offer a better claims experience to policyholders, improve their loss control, reduce loss adjustment expenses (LAE) and engage markets faster. The underwriting offering brings actionable risk information into a single app and API service suite, enabling carriers to improve their risk selection and underwrite more consistently and profitably. The platform’s advanced technologies and geospatial data analytics enable companies to own their view of risk, unlocking insights to better manage their exposure and grow their portfolios profitably.
Please reach out to the contacts below for more information.
Contacts
| James Waller, PhD | Josh Darr | |||||||
| Research Meteorologist, Guy Carpenter |
Head of North America Peril Advisory |
|||||||
| James.Waller@guycarp.com | Josh.Darr@guycarp.com | |||||||