
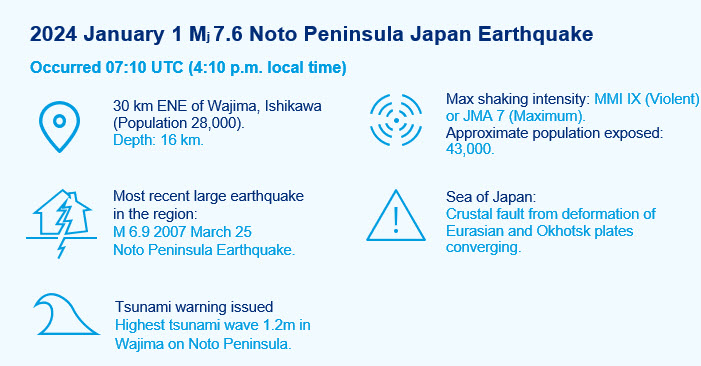
Event Headlines
- A strong Mj 7.6 (Mw 7.5) earthquake struck the Ishikawa Prefecture in Japan in the afternoon of New Year’s Day 2024 about 30 km from Wajima City. The maximum JMA Seismic Intensity of 7 was felt by more than 40,000 people on the Noto Peninsula.
- The January 1 earthquake is the largest event close to Honshu since the Tohoku earthquake sequence.
- More than 50 aftershocks of M ≥4 were recorded in the first 3 days.
- At the time of writing, more than 200 fatalities have been reported.
- Damage from ground shaking has been most severe in the Ishikawa Prefecture, with reports of more than 290 collapsed structures (as of January 9). Moderate damage has been reported in Niigata and Toyama prefectures, with light damage in Fukui and Nagano.
- Secondary impacts due to liquefaction, landslide, fire following earthquake, and tsunami have been reported mostly in the Ishikawa Prefecture. Observed tsunami heights along the western coastlines of Japan did not exceed 1 meter, apart from near Wajima on the Noto Peninsula at 1.2 meters.
Post Event Report: Noto Peninsula Japan Earthquake
The Noto Peninsula, Japan Earthquake post-event report comprises the following sections:
- Physical Discussion of the Earthquake
- Seismotectonic Context
- Damage Impacts and Secondary Perils
- Comparison with Historical Events
Physical Discussion of the Earthquake
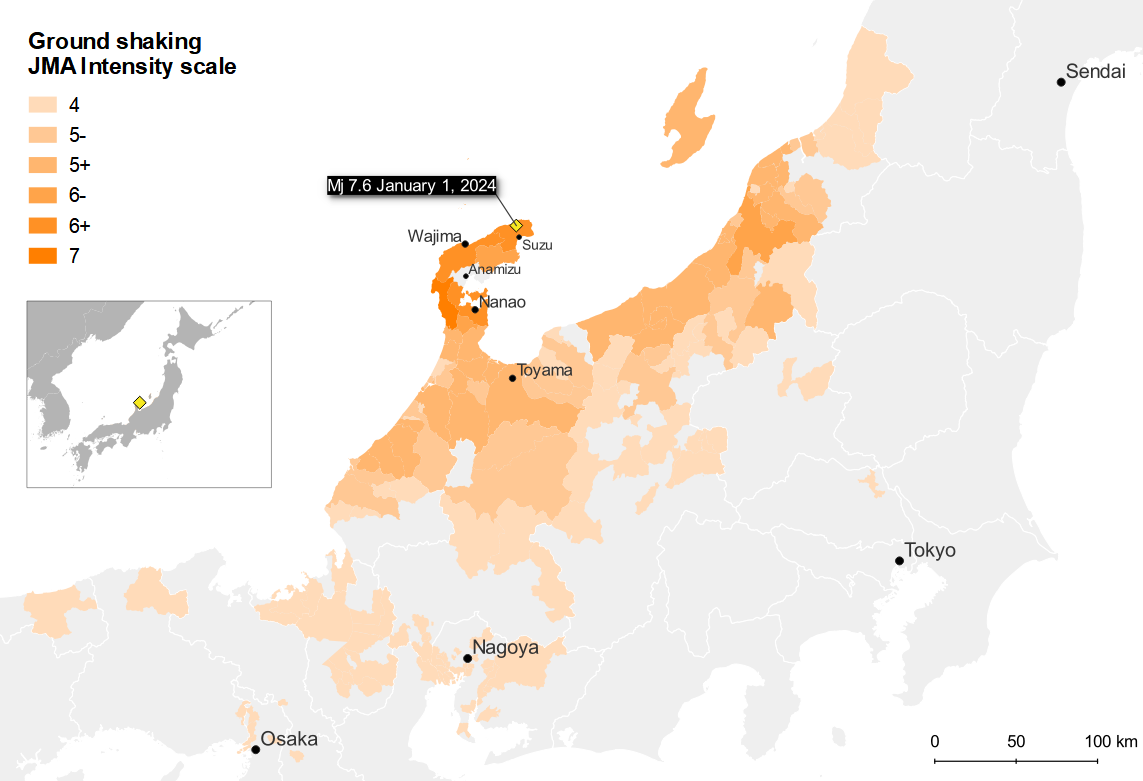
This Mw 7.5 (Mj 7.6) earthquake, the largest in Japan in nearly a decade, occurred at 4:10 p.m. local time (7:10 UTC) on Monday January 1, 2024, on the island’s west coast with an epicenter on the northern Noto Peninsula, 30 km east northeast of Wajima. It was the result of a long (150+ km) and shallow (<10 km) reverse fault with moderate dip slipping as much as 3.5 meters. This fault stretches across both land and sea, and as a result a moderate tsunami (<1 m) occurred. Severe shaking from this earthquake was limited to areas on the Noto Peninsula and the surrounding coastline (reaching maximum intensity 7 on the JMA Seismic Intensity Scale; Figure 1), while light shaking intensities were reported across much of Honshu (Japan’s main island).
Figure 1: JMA observed ground shaking intensities (maximum by municipality) of the Mj 7.6 Noto Peninsula Japan earthquake (4:10 p.m. local time).

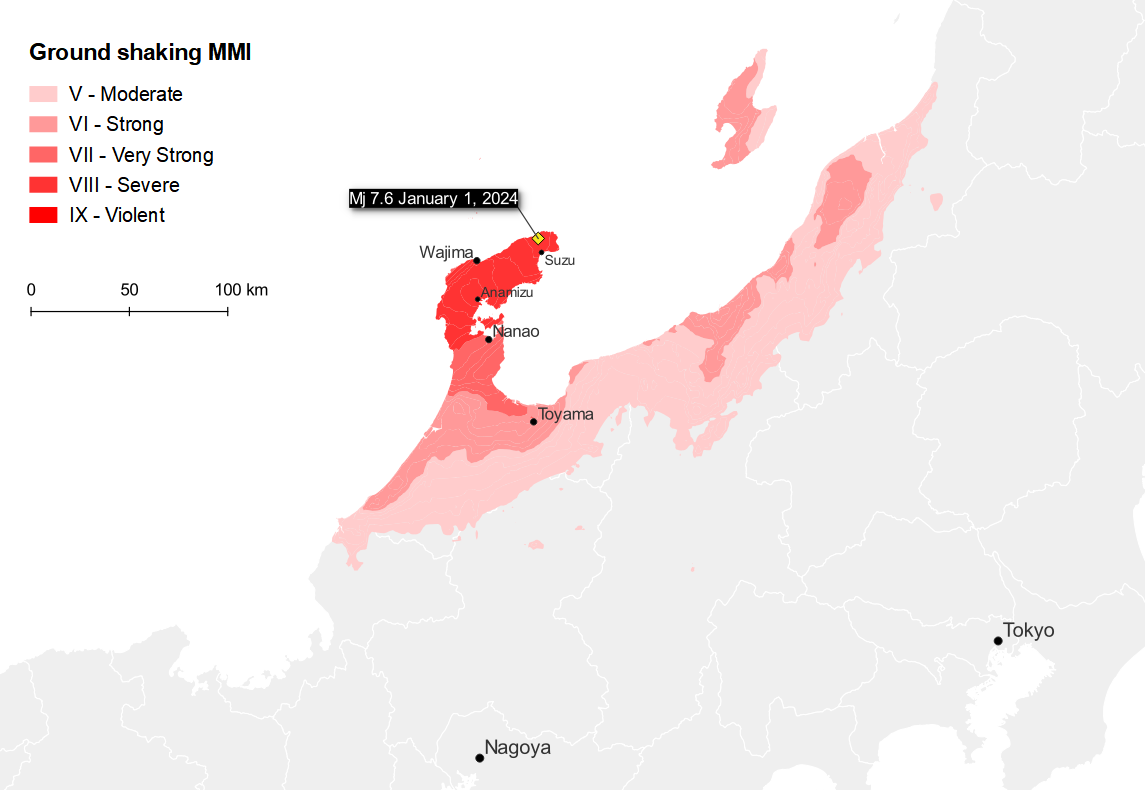
Figure 2: USGS simulated ground shaking intensities of the Mw 7.5 Noto Peninsula Japan earthquake (4:10 p.m. local time).
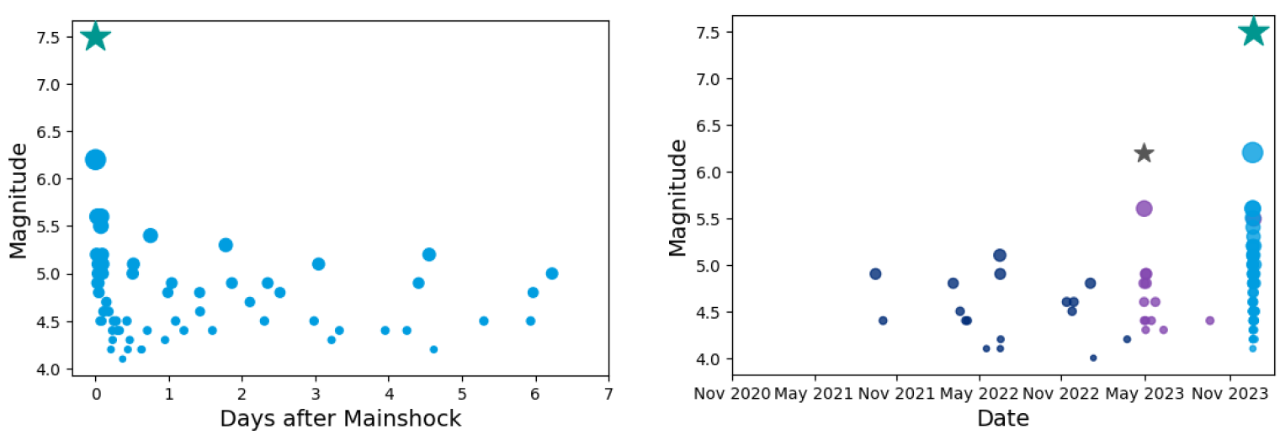
In the 7 days following the Mw 7.5 Noto Peninsula earthquake, more than 50 M ≥4.0 aftershocks have occurred close to the proposed rupture fault trace (Figure 3). Of these aftershocks, 17 were M ≥5.0 and the largest was a Mw 6.2 event, which occurred around 8 minutes after the mainshock. While the aftershock rate in the region already appears to be decaying (Figure 4a), as is typically expected, significant aftershock activity may occur in the coming weeks given the considerable magnitude of the mainshock. There is a relatively low probability that another earthquake of greater magnitude than the largest aftershock already seen (Mw 6.2) will occur.
Prior to the 2024 January 1 earthquake, the Noto Peninsula has been subject to a swarm of seismicity, with more than 20,000 (Mj≥1.0) earthquakes having been identified since November 2020 (Kato, 2024). On 2023 May 5, a Mw6.3 earthquake occurred near the northeast tip of the peninsula, followed by several M≥4.0 and one Mw5.6 earthquake. By the end of 2023 May, significant seismicity had subsided.
Aside from one M4.4 earthquake in September 2023, the next significant earthquake to occur near the peninsula was a Mw5.5 event on 2024 January 1 (Figure 4b). This was a foreshock 4 minutes prior to the Mw7.5 earthquake. While the January 1, 2024 Mw7.5 Noto Peninsula Earthquake had only 1 significant foreshock in the days leading up to it, some may refer to seismicity throughout 2023 (or as far back as 2020) as precursory foreshock behavior. However, others may refer to the Mw6.3 2023 May 5 earthquake as another mainshock, as it had appeared contemporaneously.
Figure 3: The spatial distribution of seismicity (M ≥4) near the Noto Peninsula since November 2020, including the proposed fault for the Mw7.5 earthquake in light blue and the epicenters of both the Mw7.5 and the Mw6.3 2023 May 5 earthquakes indicated with stars.
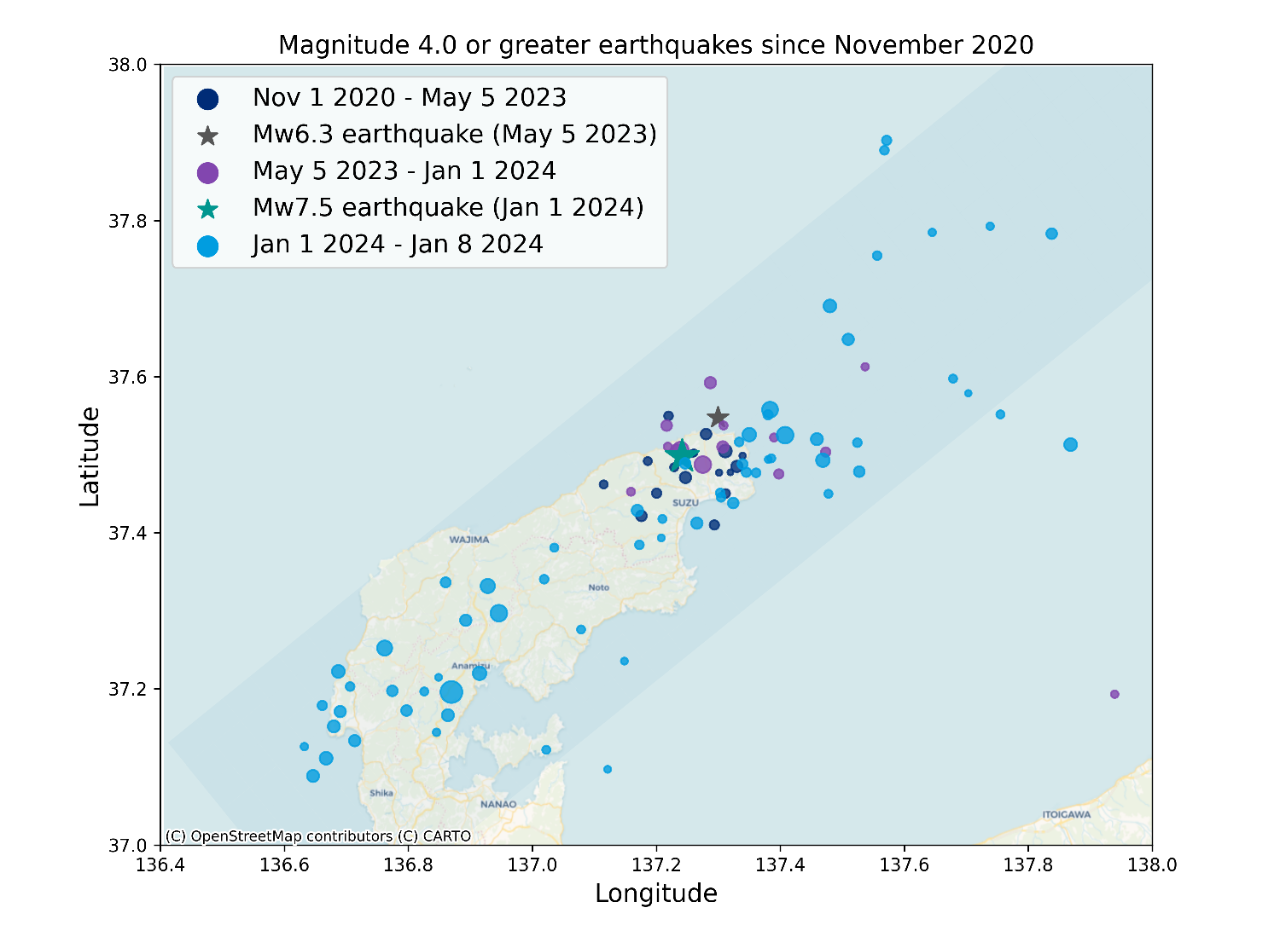
Figure 4: The temporal distribution of seismicity (M≥4) near the Noto Peninsula: a) following the 2024 Mw7.5 earthquake, and b) since November 2020.
Seismotectonic Context
Japan’s west coast is dominated by crustal faults accommodating stress from the 1 cm/year movement of the Eurasian plate toward the Okhotsk plate, on which Japan lies, and historically several earthquakes around this size are known to have occurred in the region. The magnitudes of earthquakes on the west coast are smaller compared to Japan’s east coast, which is seismically dominated by the subduction zone capable of producing M9s moving at a rate of 8 cm/year (Jaquet, et al., 2012). Both coasts of Japan are primarily convergent boundaries between tectonic plates, although the exact location of the plate boundary between Eurasia and Japan on the west coast is less understood.
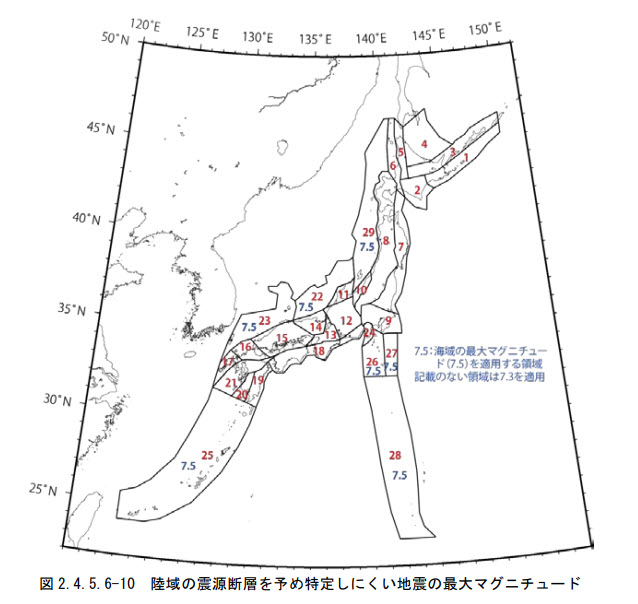
Near the Noto Peninsula, Japan’s national seismic hazard (HERP) model includes moderate background seismicity, with maximum magnitudes of M 7.3-7.5 that were updated following the 2011 Tohoku Earthquake (Figure 5). Background sources are used to represent seismicity that is not well constrained or assigned to a specific source. Notably, there was a historical earthquake in 1751 with an estimated magnitude of 7.0-7.4. The 2024 January 1 earthquake was notable in size but did occur on a known fault.
Figure 5: Japan National Seismic Hazard Model Background Seismicity Regions and their Maximum Magnitudes. Most of the Maximum Magnitudes for the regions in the figure are set to 7.3, except where indicated with 7.5. For example, Region 22 has a Maximum Magnitude of 7.5 and Region 11 has a Maximum Magnitude 7.3.
Damage Impacts and Secondary Perils
At the time of writing, the Japanese Fire and Disaster Management Agency (FDMA) has reported more than 2,000 damaged residential buildings, of which 293 were complete or total collapses, predominantly in Ishikawa Prefecture and Wajima City. Building damage has also been observed in Niigata, Toyama, Fukui, and Nagano Prefectures. The FDMA reported 202 fatalities in Ishikawa Prefecture and more than 500 injuries across 9 prefectures on January 9.
It is reported that there are about 26,000 individuals in shelters in Ishikawa Prefecture, almost 12,000 are from Wajima, which has a population of about 28,000. Similarly, around 6,000 individuals, half of Suzu’s approximately 13,000 population, are in shelters. Suzu, at the northern tip of the peninsula, also suffered damage from the May 5, 2023 earthquake.
Compared to other major global earthquakes in the last 12 months (e.g. Turkey Mw 7.8, Morocco Mw 6.8), the levels of observed damage and casualties are relatively low, despite the Japanese event’s magnitude and some seismic stations recording ground shaking accelerations in excess of 1g. This is partly because the earthquake occurred in the less populated region of Honshu, more than 200 km away from major cities such as Tokyo and Nagoya. However, the building performance is a testament to the high level of disaster preparedness and resilience practiced in Japan. Strong and well-enforced building design codes that ensure the seismic resistance of modern buildings, and policies and support schemes to encourage the retrofit of older buildings.
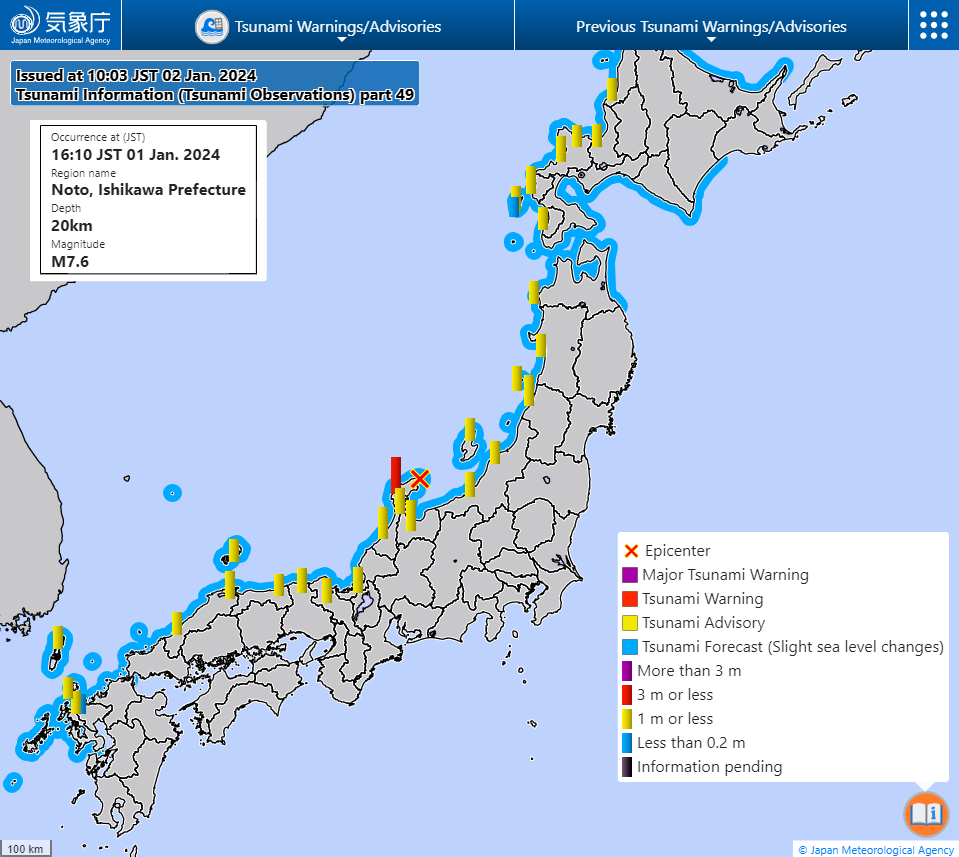
In addition to ground shaking, the 2024 Noto Peninsula earthquake is notable for significant occurrences of secondary perils. A major tsunami warning was issued around the Noto Peninsula, with warnings and advisories issued for the remainder of the west coast. These were all subsequently downgraded, although waves of up to 1.2 m were observed near Wajima (Figure 6).
Figure 6: Observed tsunami depths following the January 1, 2024 Mj 7.6 Noto Peninsula Japan Earthquake.
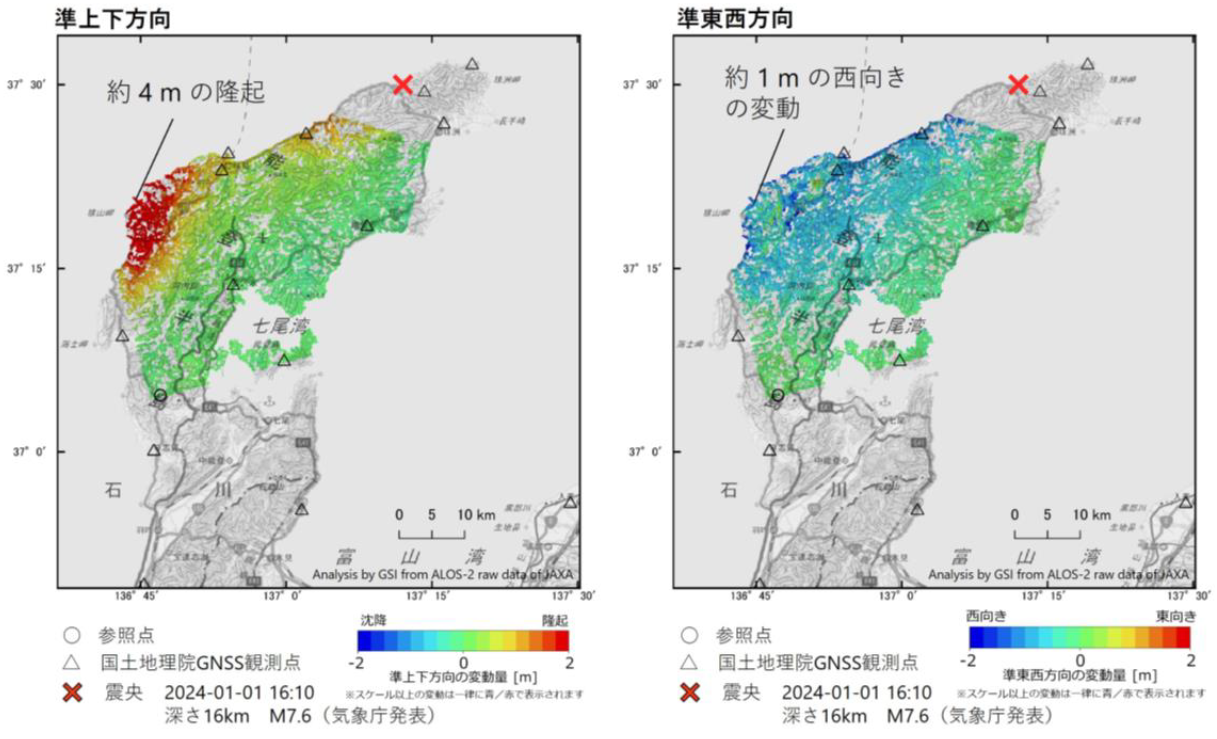
The earthquake also triggered liquefaction, landslides and significant ground deformation in the region. Geospatial Information Authority of Japan (GSI)’s satellite data estimates up to 4 meters of ground uplift in Wajima and 1 meter of corresponding horizontal ground movement to the west (Figure 7).
Figure 7: Ground uplift and movement according to satellite data processed from Geospatial Information Authority of Japan. The map on the left indicates up to 4 meters in uplift on the western side of the Noto Peninsula, and the map on the right indicates up to 1 meter of horizontal displacement.
Infrastructure damage and outages have been reported in the region. Oil leaks at the Shiga Nuclear Power Plant and the shutdown of 2 units in the Nanao Thermal Power Plant have been reported. Additional damage to electric power distribution systems, including substations and utility poles, resulted in outages. As of January 9, there were approximately 15,000 homes without electricity in Wajima, Suzu, Noto, Anamizu and Nanao. Approximately 60,000 homes in 14 cities in Ishikawa were without water. One week following the earthquake, 11 waste-water treatment facilities were not operational due to damage.
Transportation infrastructure suffered damage due to the earthquake. The runway of the Noto Airport reportedly is damaged, and all flights were cancelled until January 24 at the time of writing. According to the Ministry of Land, Infrastructure, Transport and Tourism, the Anamizu Station run by the Noto Railway was severely damaged, and there was also heavy damage between Hakui and Wakuraonsen stations on the Nanao Line operated by JR-West. Services will not resume for these stations in the near future. Numerous road sections are closed on the main arteries of the Nōetsu Expressway, National Route 249, due to buckled roads, subsidence or landslides.
Agricultural facilities and fisheries have experienced operational interruptions due to outages of electric power and water supply. There has been reported damage to cash crops, such as strawberries and tulips, as well as to chicken coops and rice warehouses. Onshore aquaculture tanks were damaged in the earthquake. Seawalls and wharves in fishing ports sustained damage due to the ground shaking and liquefaction. Following the earthquake, reportedly more than 120 ships capsized or sank, 110 of them were in Suzu.
Notably, a fire broke out in the ancient market in Wajima City, destroying 200 stalls and residential structures in the vicinity. Fires were reported in Kanazawa, Nanao, Suzu, and Noto in Ishikawa Prefecture and in Takaoka in Toyama Prefecture. Many of the towns and cities in this part of Japan are characterized by pockets of densely packed traditional timber construction, which can be at high risk for fire spread. The older timber construction also is more likely to suffer significant damage from ground shaking if not previously retrofitted, and early photos of damage in the region indicate many building collapses are primarily from older, weaker construction. Further investigation is needed, but it is possible that much of the observed impact (building damage and casualties) is the result of these secondary perils, especially fire, rather than poor structural performance in response to ground shaking.
Comparison with Historical Events
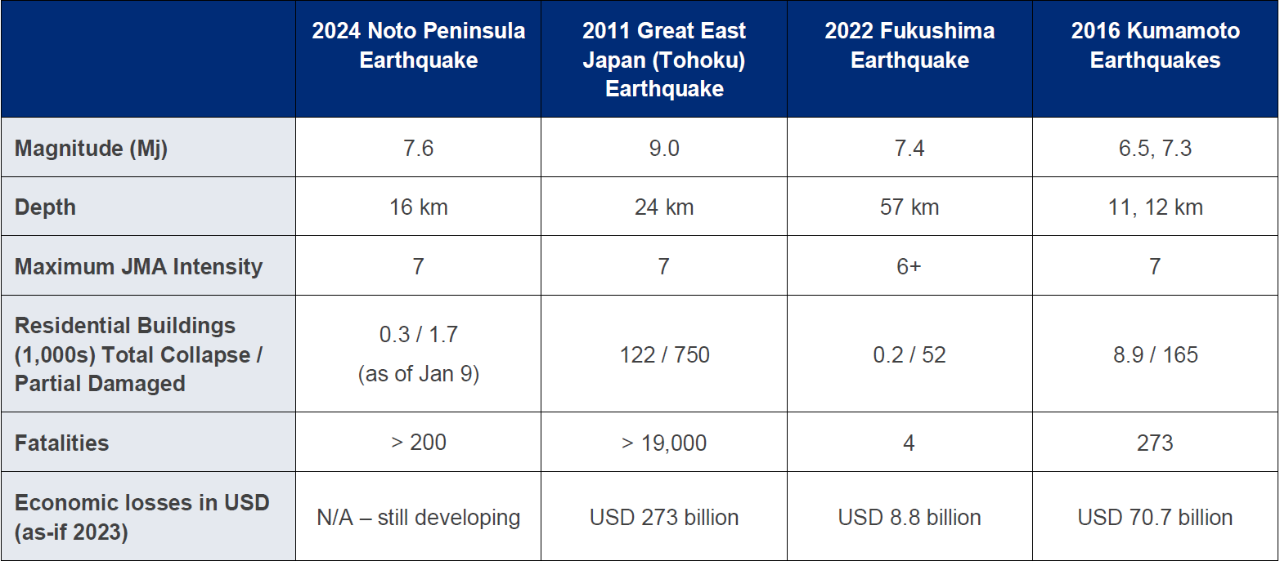
At a high level, Table 1 compares information across recent significant Japanese earthquakes impacting the insurance industry to the January 1, 2024 earthquake. Note: Information related to the 2024 earthquake is preliminary and will be changing as the event develops.
Table 1: Comparison of Mj7.6 Noto Peninsula, Japan Earthquake to recent significant Japanese historical earthquakes.
Post Event Report: Noto Peninsula Japan Earthquake
Sources: Japan Meteorological Agency, US Geological Survey, Japan Cabinet Office Disaster Report, Japan Fire and Disaster Management Agency, Japan Ministry of Land, Infrastructure and Tourism, and Ishikawa Prefecture Disaster Report
References
Geospatial Information Authority of Japan (GSI). The Niigata-Kobe Tectonic Zone. https://www.gsi.go.jp/cais/tectonics_niigata_kobe-e.html
Jaquet, O. & Lantuéjoul, Christian & Goto, J. (2012). Probabilistic estimation of long-term volcanic hazard with assimilation of geophysics and tectonic data. Journal of Volcanology and Geothermal Research, 235–236. 29–36. https://doi.org/10.1016/j.jvolgeores.2012.05.003.
Kato, A. (2024). Implications of fault-valve behavior from immediate aftershocks following the 2023 Mj6.5 earthquake beneath the Noto Peninsula, central Japan. Geophysical Research Letters, 51, e2023GL106444. https://doi.org/10.1029/2023GL106444
NIED, Improved Seismic Hazard Assessment after the 2011 Great East Japan Earthquake, Technical Note of the National Research Institute for Earth Science and Disaster Prevention: No.399.