Hawaii Flood--March 9-22, 2026
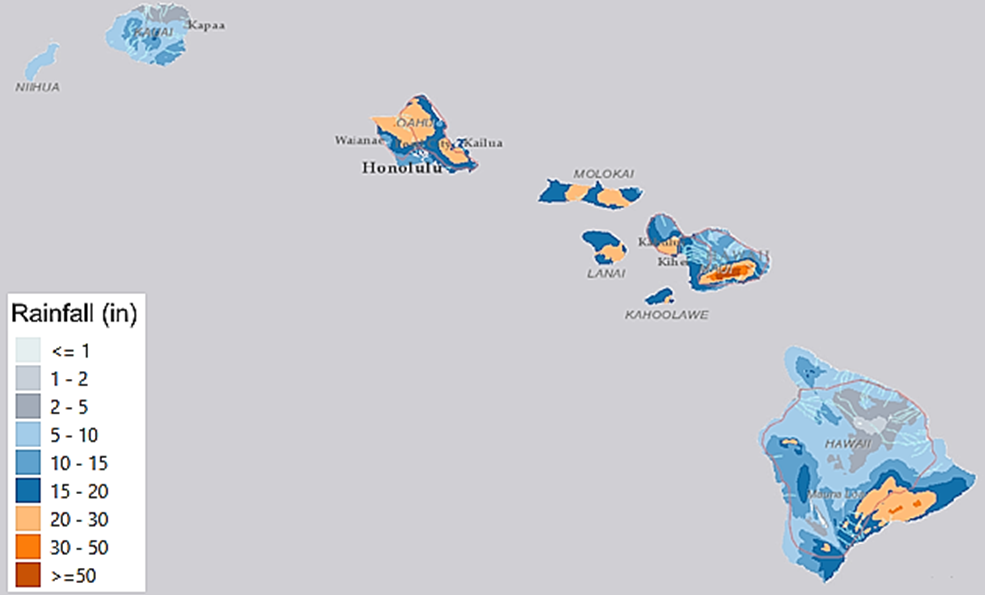
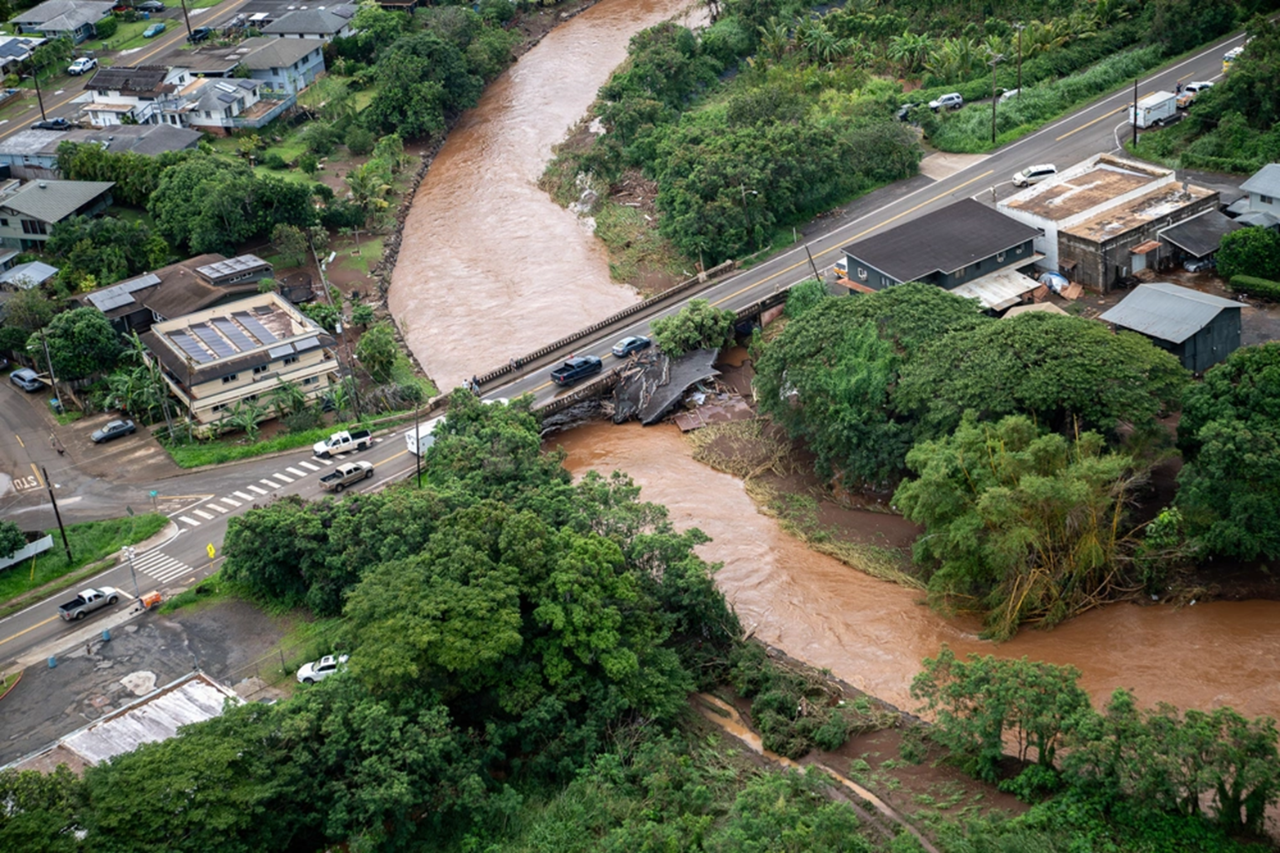
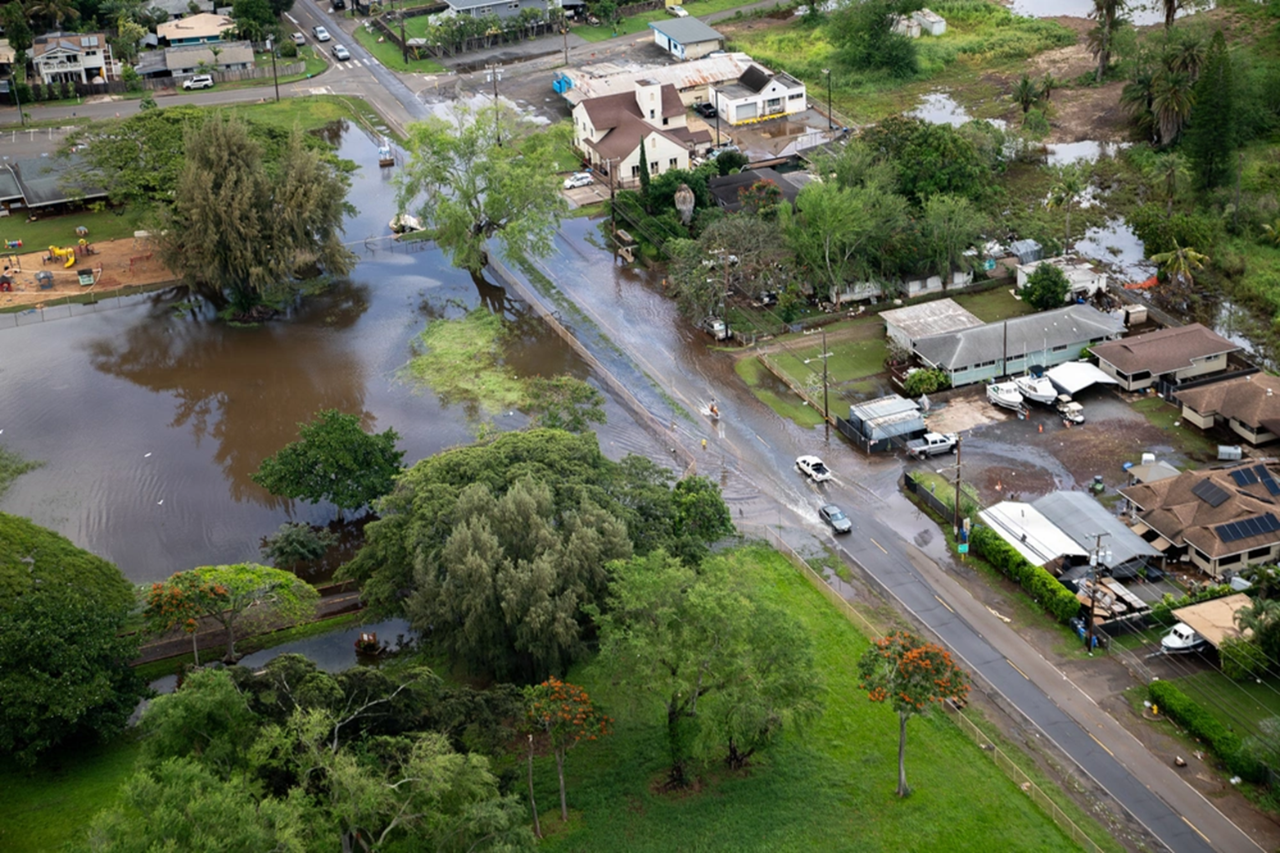
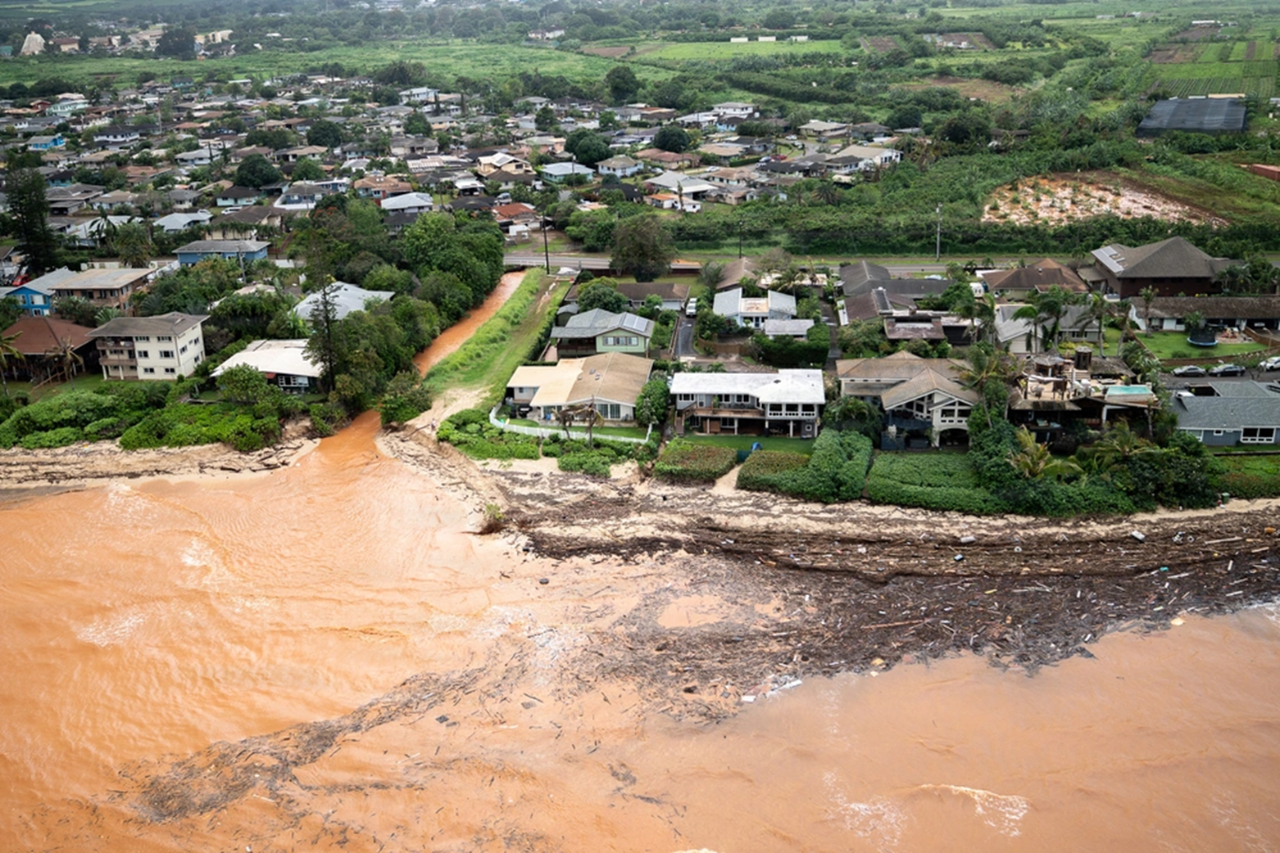
Hawaii experienced a major flood and wind event driven by an intense multi-day Kona low storm pattern. Repeated rounds of heavy rain produced widespread totals of at least 5 to 10 inches across most islands, with swaths of 15 to 25 inches over parts of Maui and Hawaii Island and localized 30+ inch totals in upslope terrain. Honolulu broke a 24-hour rainfall record that had stood for 75 years. Due to the impact of catastrophic flooding, many roadways collapsed, residential homes were swept into rivers, and communities were cut off for days. The severe flooding phase that struck every major island in the chain has been described as the worst in the past 2 decades since the 2004 flood event. Impacts and recovery information are still developing.
Post-Event Report: Hawaii Flood March 2026
Key headlines
Hazard magnitude−Multi-day rainfall with island maxima of 49.57 inches on Maui and 38.77 inches on Hawaii Island, plus damaging winds with locally extreme gusts at hurricane strength exceeding 135 mph.
Impact signal−Widespread flooding and landslides, significant disruptions to power and transportation, and ongoing damage assessment with early statewide economic loss estimates over $1 billion.
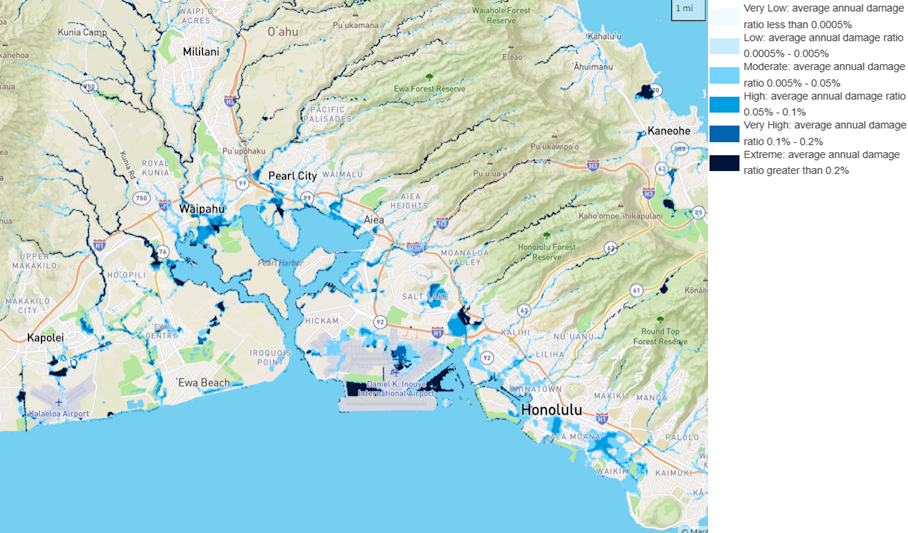
Flood defense stress−Heightened concern around Wahiawa Dam on Oahu, including evacuation planning and close monitoring of reservoir levels during peak rainfall.
Event Recap and Damage Impact
Meteorological Discussion
The March 2026 impacts were driven by 2 back-to-back Kona low systems rather than a single storm. The first Kona low stalled northwest of the islands during roughly March 9 to 15, repeatedly pulling deep tropical moisture into the state and producing multiple waves of torrential rainfall and embedded thunderstorms across the major islands, alongside damaging south to southwesterly winds.
Just days later, a second Kona low arrived around March 19, bringing another round of heavy rain onto already saturated watersheds and elevated stream flows. This sequencing helped amplify runoff response and prolong flooding impacts, since the second wave occurred before soils, channels, and infrastructure systems had time to recover from the initial event. The dual-system pattern with two major Kona lows within 10 days, is considered highly unusual by National Weather Service (NWS) meteorologists.
Damage Summary
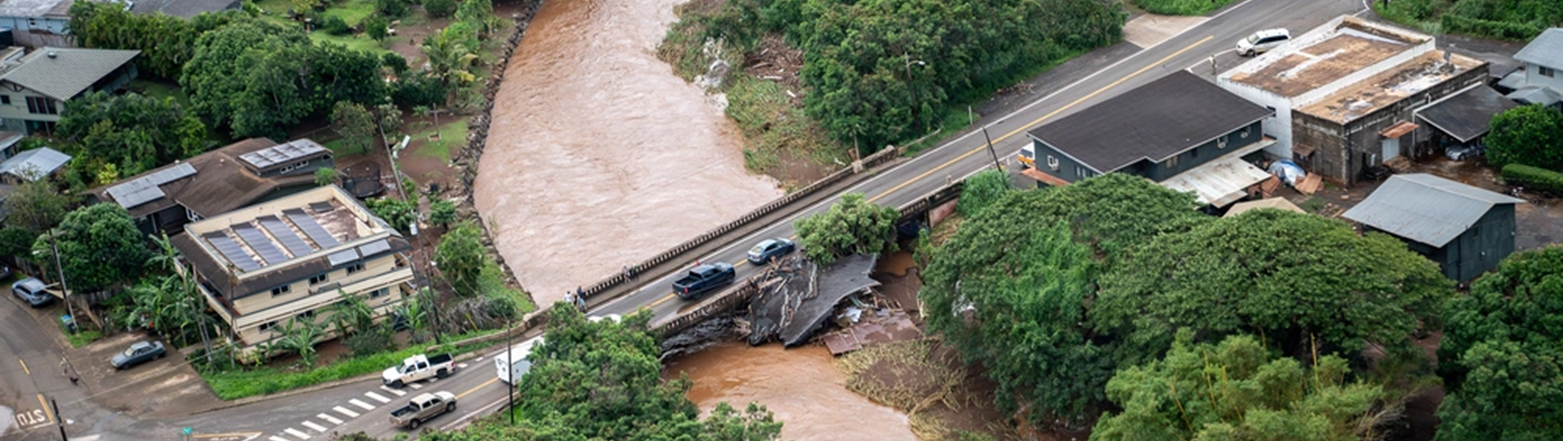
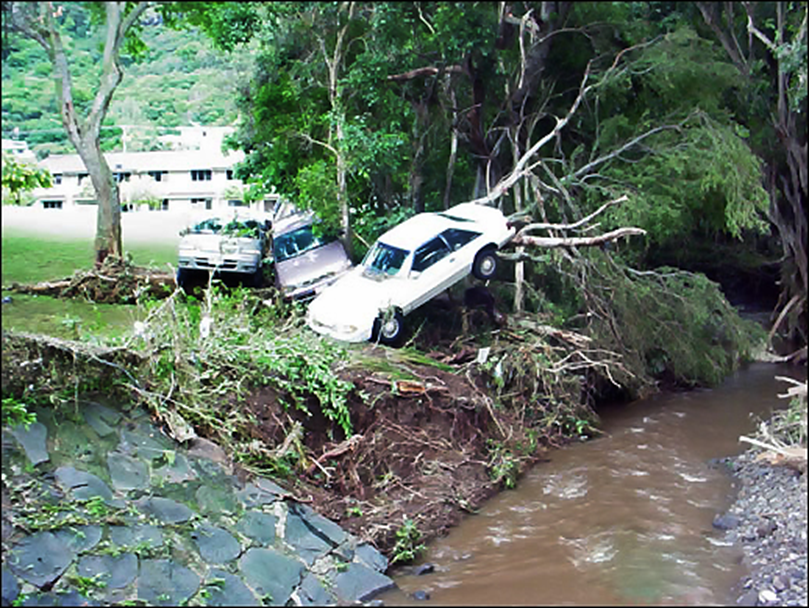
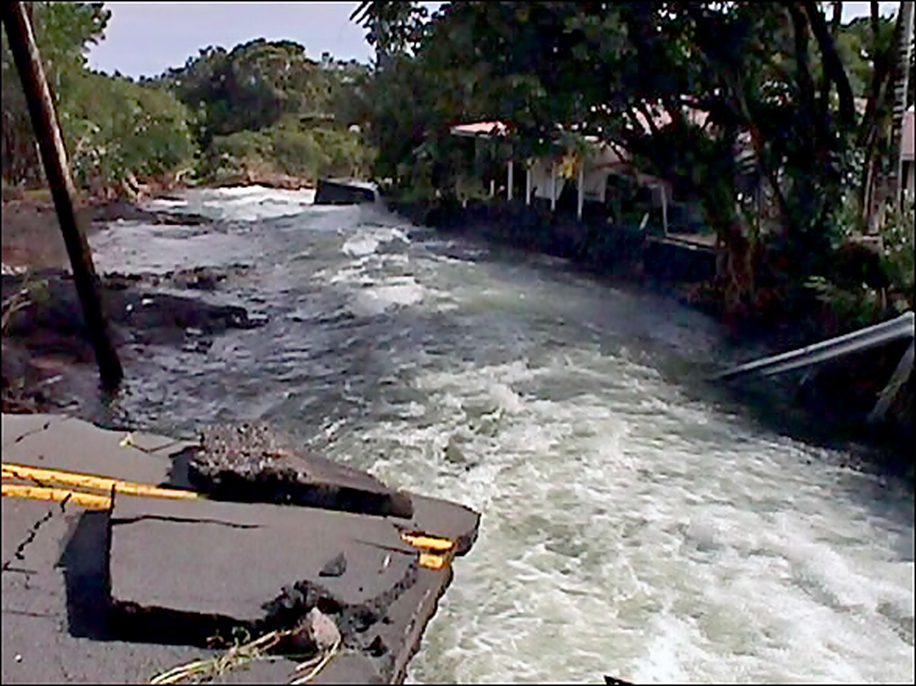
Flooding and wind drove widespread disruption across the state. Reported impacts included numerous road closures from flooding, debris, and landslides; overflowing streams and drainage channels; inundation of homes and businesses; swift-water rescues; rockfalls; and localized sinkholes and erosion issues. Cleanup needs were significant in some urban corridors where debris and sediment accumulated in drainage features, and multiple public facilities required cleanup following water intrusion. Agricultural impacts were also notable, including flooded fields, downed trees, damaged farm structures, and operational disruptions.
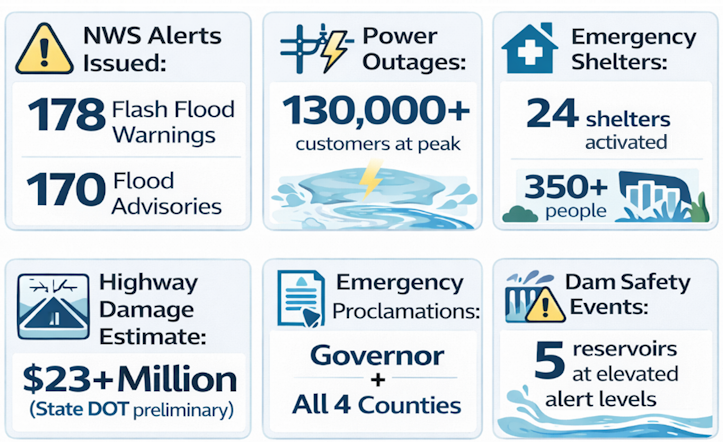
Power and emergency response impacts were substantial for this event. At the storm’s peak, more than 130,000 Hawaiian Electric customers were without power, and by the afternoon of Sunday, March 22, more than 32,000 were still without electricity as repair crews worked through restoration. Emergency services reported numerous calls for help in flood-impacted areas, and officials indicated that more than 350 people were pulled from hazardous conditions during the peak response period. Early statewide damage estimates communicated publicly were on the order of USD 1 billion across public and private infrastructure, with assessments ongoing.
Flood Mitigation, Insurance and Climate Implication
Dam Crisis and Community Rating System (CRS)
Flood defense lens: This event underscores that flood risk is not only “water on streets,” but also the performance of flood defenses and the effectiveness of emergency operations under extreme rainfall. During the peak period, the 120-year-old Wahiawa Dam in central Oahu drew focused attention, including evacuation order for 5,000 residents in downstream areas and close monitoring of reservoir levels. Practical resilience actions include real-time reservoir and stream monitoring with reliable telemetry, clear operational triggers for spillway releases and evacuation thresholds, downstream inundation mapping tied to operational scenarios, and well-practiced Emergency Action Plans with coordinated public communications. Following this event, longer-term priorities will include targeted improvements to spillway capacity, outlet works reliability, debris management, and redundancy in monitoring and communications to reduce the likelihood that extreme rainfall escalates into a cascading flood-defense crisis.
Hawaii’s CRS context: FEMA’s Community Rating System (CRS) provides premium discounts for communities exceeding minimum NFIP floodplain management standards, but Hawaii counties currently sit in the low range of CRS performance (Hawaii and Maui Counties being Class 7, Honolulu City and County and Kauai County being Class 8; lower class is better, with Class 1 being the strongest). The implication is that premium discounts exist but are limited, and there may be opportunity over time to strengthen floodplain management, mapping, public outreach, and warning and preparedness programs to improve CRS class and support higher coverage take-up.
Coverage Gap
Flood insurance coverage across the state remains low. Only about 4.2% of properties in Hawaii carry flood insurance. FEMA estimated more than 400,000 properties statewide do not have coverage. In an event like this, where flood losses can be widespread but highly localized, low take-up can slow household recovery, increase reliance on limited public assistance, and increase the likelihood of uninsured losses for homeowners, small businesses, and the agricultural sector.
Climate Change Indications
This event is a reminder that Hawaii’s flood risk sits at the intersection of extreme rainfall, sea level rise and aging infrastructure. Even without attributing any single storm to climate change, warmer air can support heavier downpours, and rising sea levels can worsen coastal drainage and backwater conditions, making it harder for stormwater systems and streams to discharge during high-tide periods. Climate change is also increasing the intensity of Hawaii’s Kona low storms, and forecasters are still working through how to best capture the moisture behavior of these systems in predictive models.
From a risk management perspective, the practical takeaway is to treat flood risk as a changing baseline. Scenario-based stress testing, forward-looking hazard layers such as Guy Carpenter developed fluvial and pluvial risk rating, and resilient design standards help communities and insurers evaluate where today’s high-impact events could become more frequent and where interdependencies such as power, access, and drainage become key drivers of loss amplification and recovery time.
Guy Carpenter View of Flood Risk
Guy Carpenter developed baseline riverine and pluvial risk rating as well as adjustment scenarios by modeling the effects of climate change in future scenarios of 1.5°C, 2°C, and 3°C of warming to account for increased flood potentials.
Historical Event Comparisons
Oct 30, 2004
Mānoa Flood, Oahu: Damages estimated around USD $85 million (unadjusted), with major losses on the University of Hawaii at Mānoa campus; approximately 120 homes were damaged.
Nov 1 to 2, 2000
Southeast Big Island Flood: Damages estimated around USD $70 million (unadjusted), largely to roads and bridges; nearly 300 homes were destroyed or damaged and more than 2,000 disaster assistance registrants were reported.
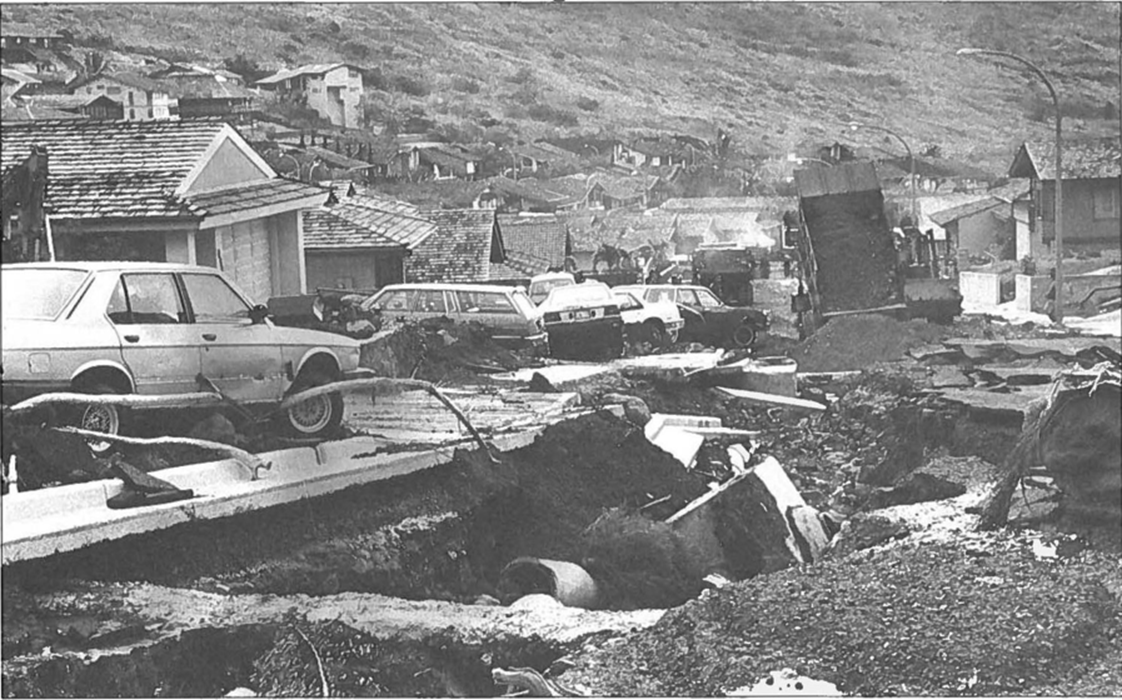
Dec 31, 1987 to Jan 1, 1988
Oahu New Year’s Eve Flood: Extreme rainfall over east Oahu triggered devastating flash flooding and debris flows. Property damages were estimated at USD $35 million (unadjusted), with more than 500 homes damaged or destroyed and roughly 2,800 people evacuated.