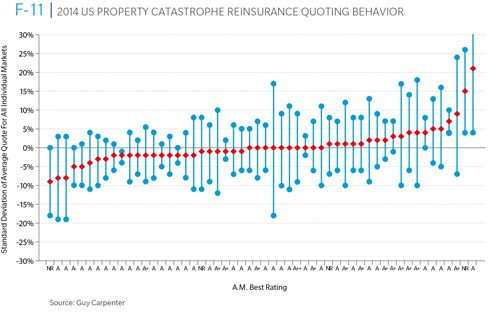
In the figure below, the January 1, 2014 average quote across all programs is represented by the line at 0 percent, while the red dots indicate reinsurers’ distances from the mean across all the programs that they quoted. The size of the line represents the variability from the average for all quotes provided by the reinsurer. Each reinsurer is represented across the bottom of the chart by its A.M. Best rating. Quotes representing non-concurrent terms were excluded.

Click here to access additional materials in GC Capital Ideas' Chart Room >>