· Between July 3-6, 2025, Central Texas experienced catastrophic flash flooding caused by a convective system fueled in part by remnant moisture from former Tropical Storm Barry.
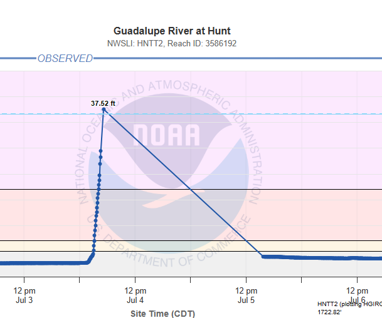
· The Guadalupe River rose rapidly, surpassing the recent peak levels of the historic 1987 flood.
· A major disaster has been declared, with Kerr County hardest hit. Over 12,000 structures were damaged in Tom Green County alone. At least 119 fatalities have been confirmed statewide, with 173 people still missing as of July 9, 2025.
· Widespread urban flooding, rescues, and infrastructure damage have been reported across the region.
Central Texas Flooding
Compounding Factors Lead to Disastrous Scenario
Key Components
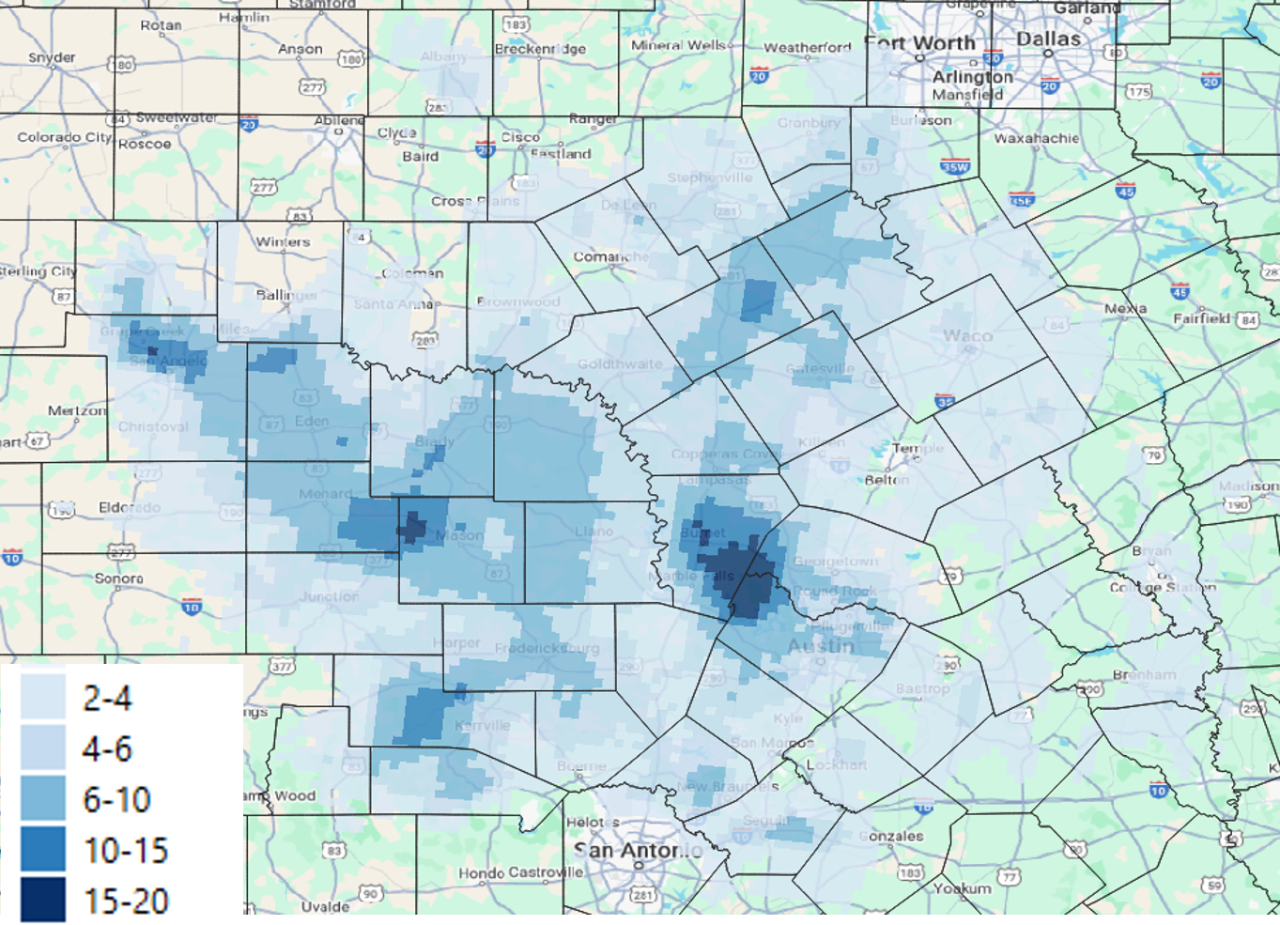
- Rainfall: Between 6-10 inches of rain fell across the Guadalupe River in central Texas, with localized areas seeing over 15 inches throughout the weekend. Friday, July 4 saw the worst of the rain, with 6.5 inches falling in just 3 hours.
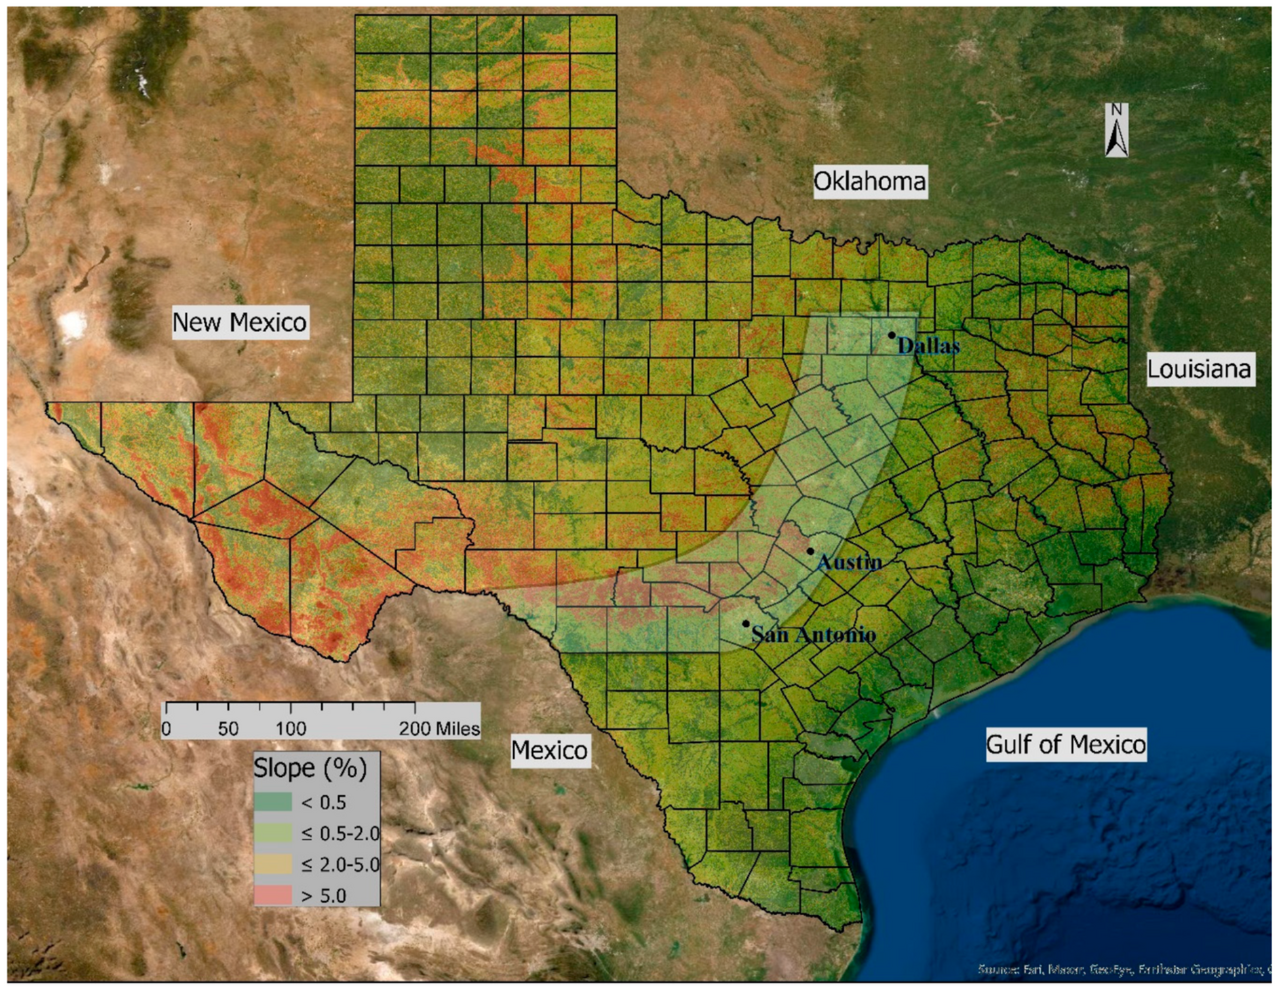
- Local Geography: The impacted area falls within Flash Flood Alley, a region in Texas known for its often and occasionally deadly flooding. Steep hills, a semi-arid climate, and clay-heavy soils make it difficult for the ground to absorb water, resulting in high volumes of runoff. This can rapidly swell rivers and creeks in manners of minutes. The impacted areas also contained many low-lying campsites with a history of flooding.
- Flash Flooding: Due to the intense rainfall, rivers rose at an alarmingly fast rate. Within 4 hours, the Guadalupe River at Hunt, Texas, rose from 7.7 feet to a peak of 37.5 feet at 5 a.m. CDT. Water volumes were so intense that the gauge temporarily failed, and estimates place the river’s actual peak at 39 feet. Because the peak in water discharge happened early in the morning, fewer people were awake to heed warning alerts.
Storm Timing and Rural Location
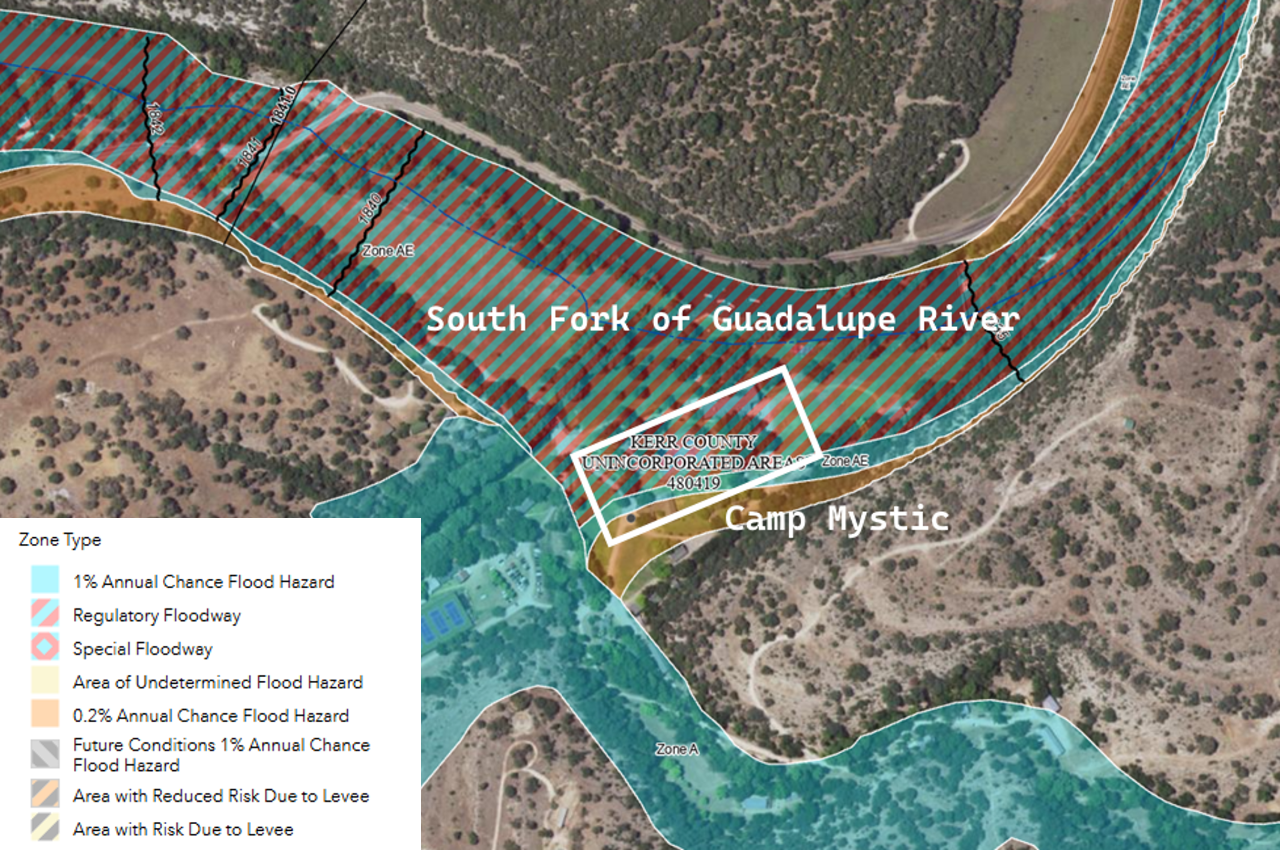
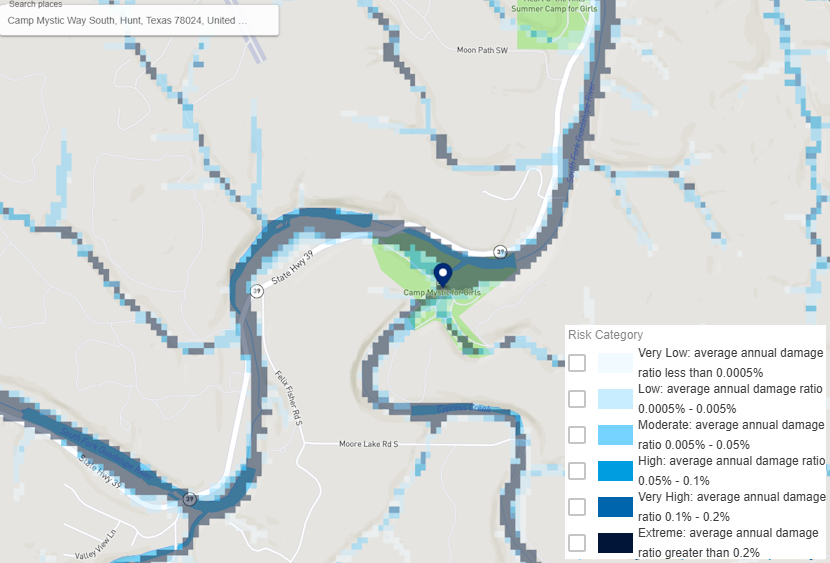
Notably, the impacted sections of the Guadalupe River are home to popular campsites and summer programs. The 4th of July holiday weekend resulted in these rural campsites being busier, and thus more populated, than usual. Some of the camps are built within FEMA regulatory flood zones as shown below, and the risk of flooding is known in the region.
While the local National Weather Service issued warnings ahead of the most intense flooding, the remote area reportedly has poor cell service, and some towns did not have adequate funding for warning sirens. There is no current evidence to suggest NWS warnings were delayed.
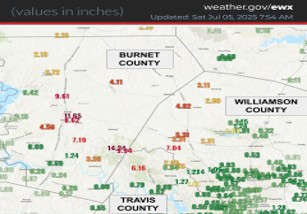
Rainfall totals over 6 hours, released at 7:54 a.m. July 5. Source: NWS Austin/San Antonio.
In addition to the system impacting a remote part of the state, the storm saw its highest intensity early in the morning. Fast-moving nighttime storms can be particularly disastrous, as most people will be asleep when warnings and alarms are issued.
Insurance Implications and GC View of Flood Risk
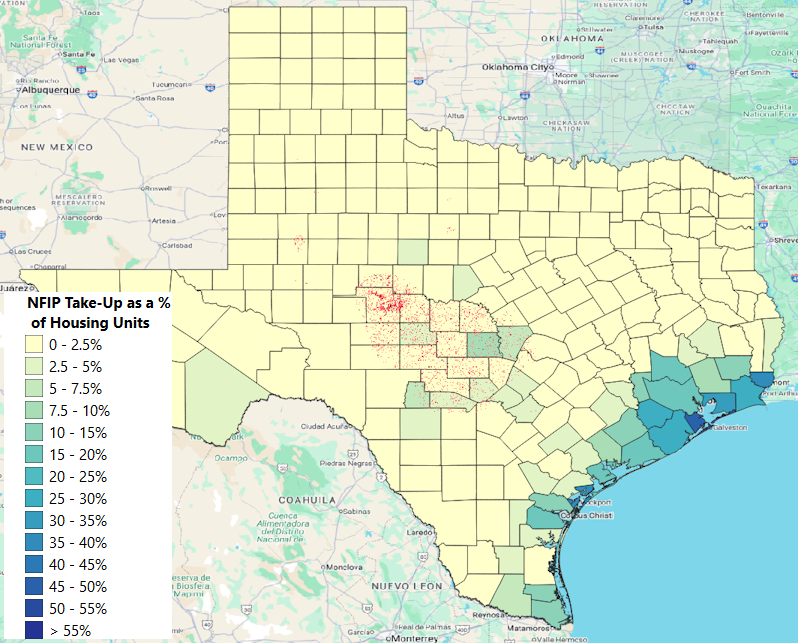
NFIP Take-up Rates and CRS Class
Most central Texas counties devastated by the July 4 weekend flash flooding show extremely low NFIP participation levels. Despite the well-documented flood vulnerability of the Hill Country, these inland regions lack the insurance coverage seen in coastal counties like Harris and Galveston. The disaster along the Guadalupe River underscores the growing protection gap in areas where flood risk is high, but perceived risk—and insurance uptake—remains low.
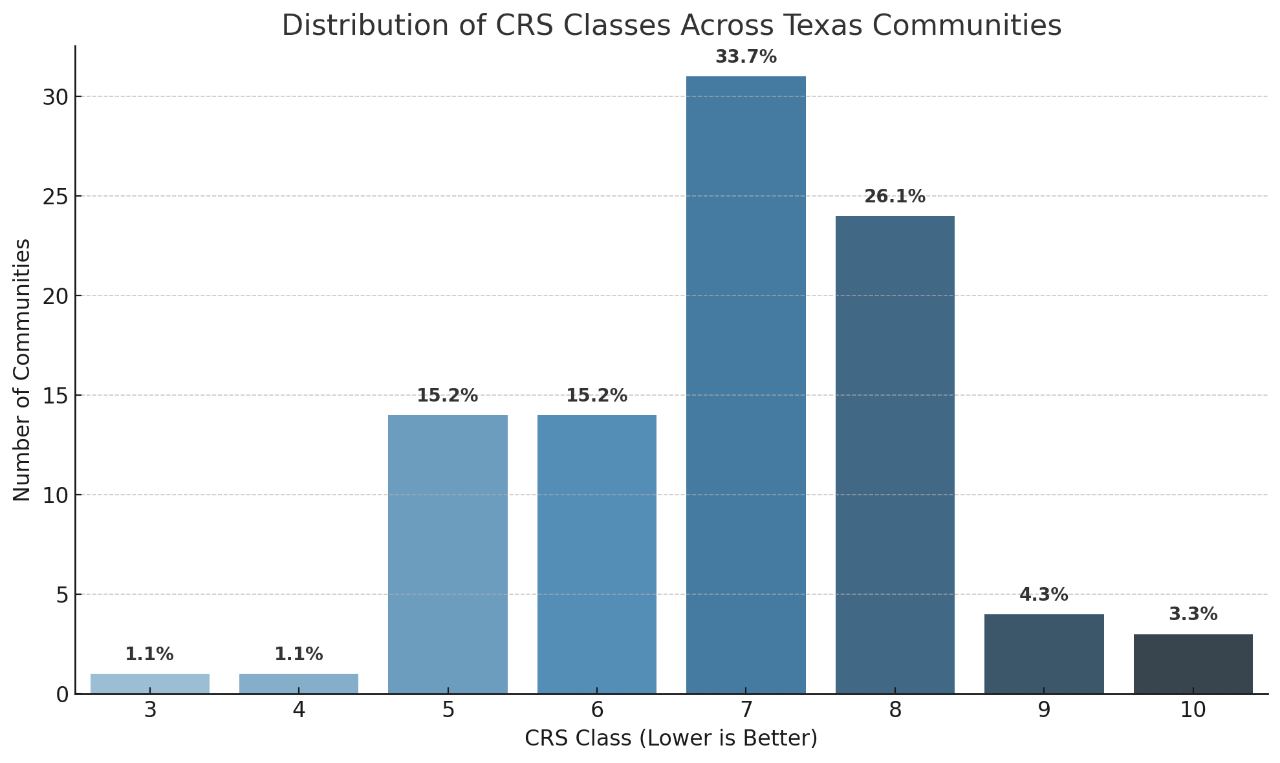
The Community Rating System (CRS), a voluntary program under NFIP, rewards communities for implementing floodplain management practices that exceed minimum NFIP requirements. Only 17% of CRS-participating communities in Texas have achieved a Class 5 or better rating, highlighting limited uptake of the highest flood mitigation standards for the state.
GC View of Flood Risk
Guy Carpenter developed a global riverine flood risk rating product as part of a multi-peril solution to enhance our client’s underwriting and portfolio management. GC also incorporated adjustments to the baseline fluvial risk rating by modeling the effects of climate change in future scenarios of 1.5°C, 2°C and 3°C of warming to account for increased flood potentials.
Climate Change and Heavy Rainfall Events
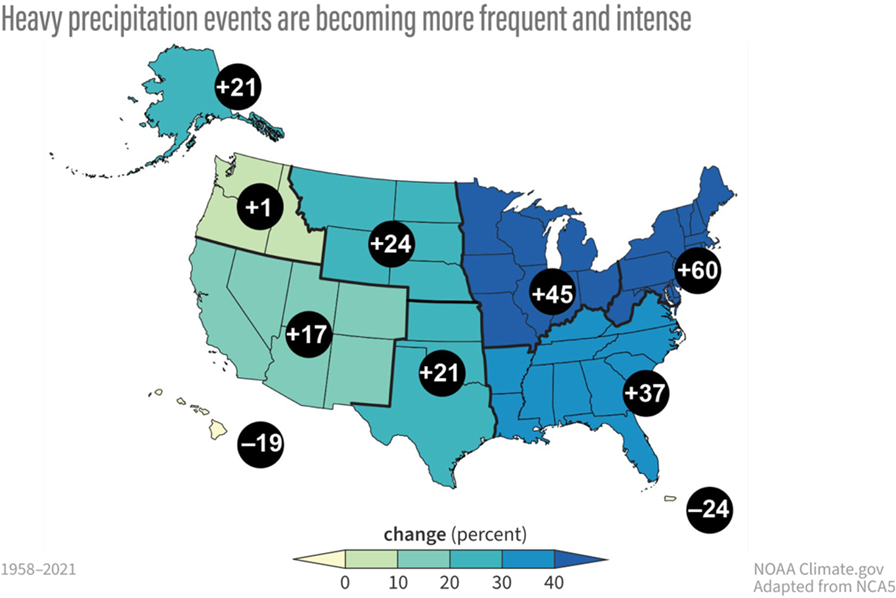
Heavy Precipitation More Common in Warmer World
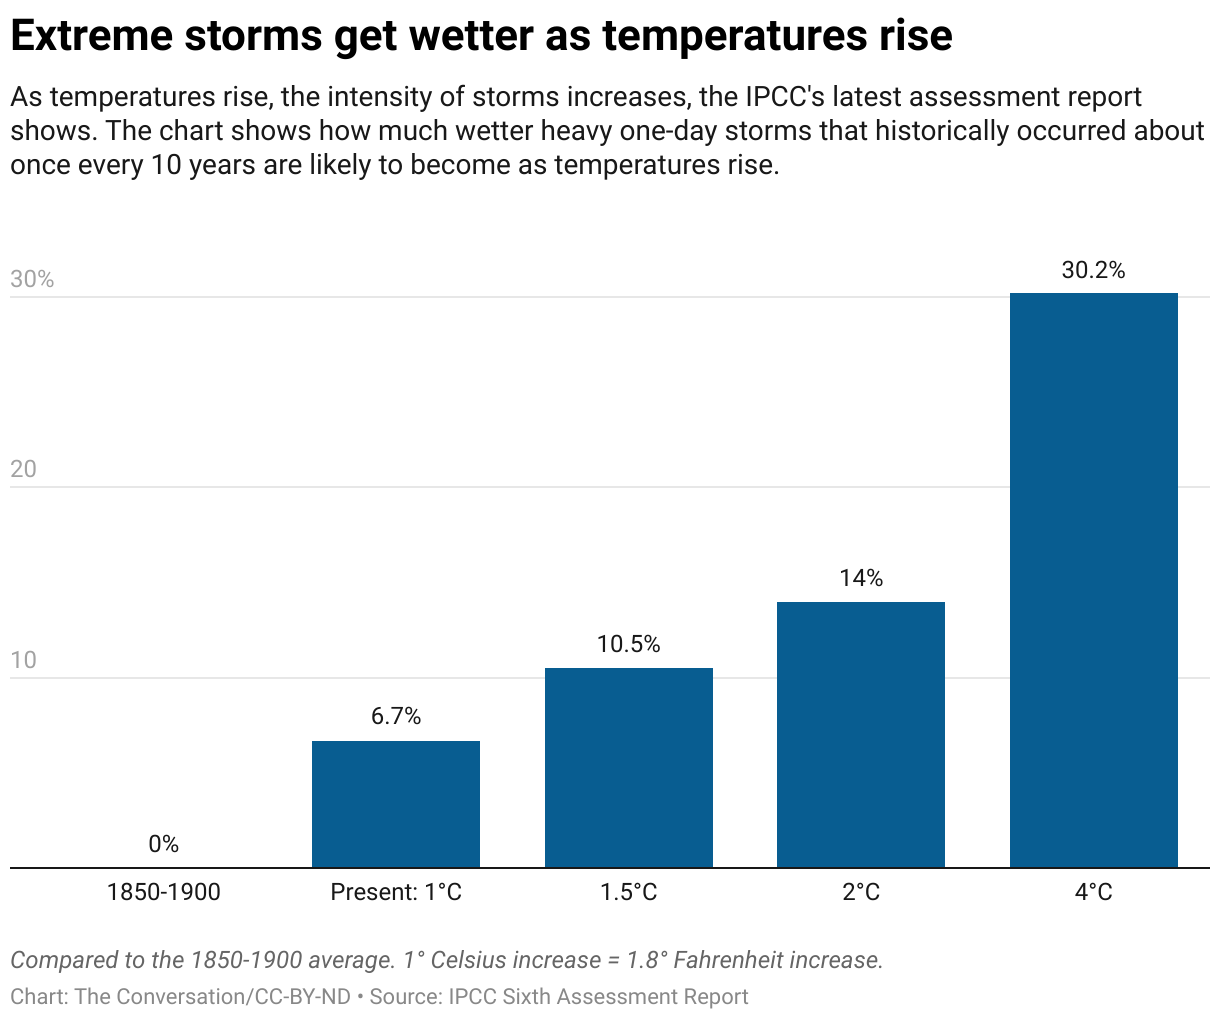
The Intergovernmental Panel on Climate Change (IPCC) highlights that heavy precipitation events have increased in frequency and intensity in many regions, leading to greater risks of flooding and other related impacts (IPCC, 2021). For every degree Celsius of warming, the atmosphere can hold approximately 7% more moisture. This enhanced moisture content contributes to more intense rainfall events and a higher likelihood of heavy precipitation.
The increase in extreme precipitation is not uniform; some regions are experiencing more frequent and intense downpours, while others may see a decrease in overall precipitation but an increase in the intensity of the heaviest events. The consensus among IPCC climate models indicates an acceleration in the changes to extreme precipitation events, highlighting the need for policymakers and the insurance industry to promote effective flood management strategies and resilience planning to mitigate the impacts of heavy rainfall.
Increasing Flood Risk
This week’s widespread flood events across the United States also underscored the growing systemic risk posed by inland and tropical rainfall-driven flooding:
- The remnants of Tropical Storm Chantal dropped over 10 inches of rain across central North Carolina on July 6, resulting in heavy localized flooding and at least 6 fatalities.
- Over 5 inches of rain fell in just 90 minutes in the Chicago metro area on July 8, leading to localized flash flooding,
- Heavy rainfall combined with recent burn scars resulted in the Rio Ruidoso, a mountain river in New Mexico, rising over 20 feet in under an hour on July 8. This led to localized flooding in Ruidoso and at least 3 fatalities.
These events, spanning diverse geographies and flood types—tropical, monsoonal, and pluvial—reinforce the urgent need for insurers and reinsurers to re-evaluate exposure in non-coastal zones, improve flood mitigation and resilience measures, and assess the implications of climate change on flood frequency and severity.
Historical Parallels
July 30-August 5, 1978
The remnants of Tropical Storm Amelia caused extensive flooding in the Texas Hill Country. Up to 48 inches of water fell, with Medina River valley taking the brunt.
Overall, the storm caused 33 fatalities across Texas, 8 of which were tied to the Guadalupe River. The flood is still considered one of the worst in state history, with an estimated USD 540 million, adjusted for inflation).
July 16, 1987
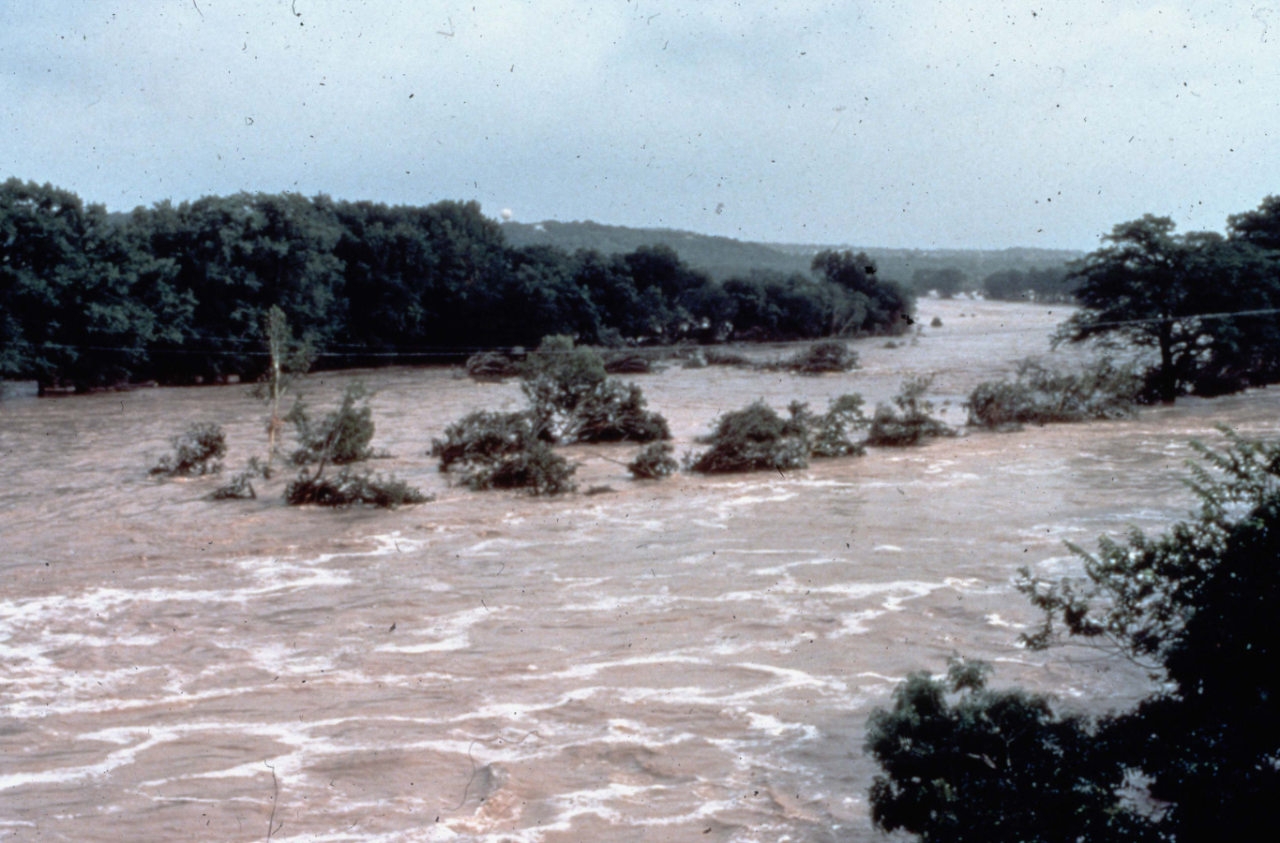
A series of severe thunderstorms passed over the Texas Hill Country, and up to 11.5 inches of rain fell west of Hunt, Texas. The Guadalupe River ultimately crested at 31.5 feet in the town of Comfort. At its peak, the flood was nearly two-thirds of a mile from its normal banks.
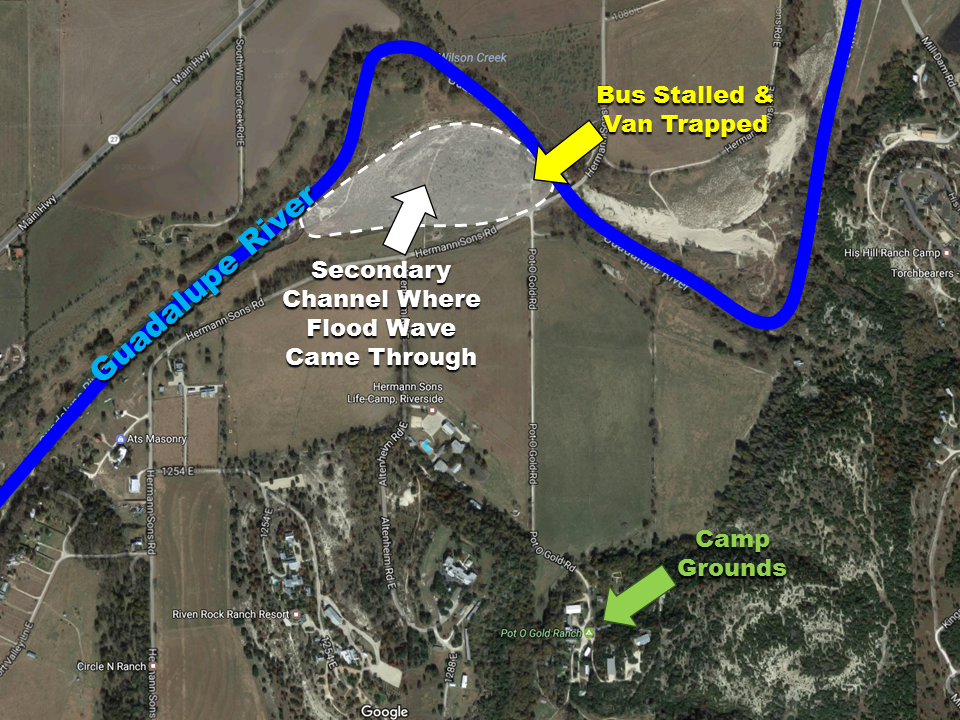
Much like the 2025 floods, the 1987 flood peaked early in the morning. Local campsites along the river were flooded, many of which hosted summer programs. 10 people died, all teenagers, when an evacuating bus and van became stranded in the flood waters.