

- An intrusion of Arctic air into the central and eastern United States has brought periods of record-setting cold to areas as far south as the Southern Plains. Along the boundary between cold and warm air, several impactful winter storms have crossed from the Southern Plains into the Mid-Atlantic over the recent two weeks.
- One of these storms, unofficially named “Uri” by the Weather Channel, has been especially impactful. Heavy snowfall, freezing rain and excessive cold have been a prolonged threat. This has brought the threat of roof collapse, and significant transportation disruption to affected areas.
- In the meantime, the record cold has also caused severe disruption to power and drinking water infrastructure for portions of the Southern Plains, with severe pipe fracture and power outages as a result for a multi-state region.
The February 2021 Arctic Outbreak CAT-i bulletin comprises the following sections:
- Regional Impacts
- Notable Impacts by Sector
- Initial Industry Assessment & Implications for 2021 Cat Year
- Key Dates in the Timeline
- Physical Discussion with Peak Meteorological Statistics
- Implications for the ’21 Cat Year
Regional Impacts
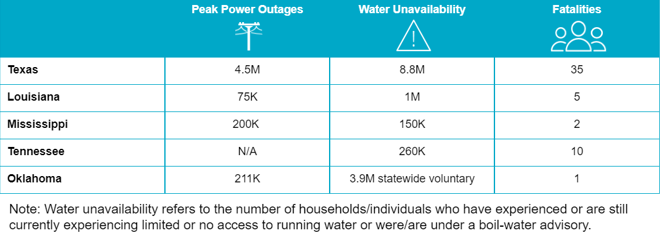
The U.S. Southern Plains states were most heavily impacted from a power, water and human fatality perspective. The leading cause of fatalities were carbon monoxide poisoning as well as hypothermia.
Texas
Impacts across much of Texas have been especially severe due to prolonged freezing conditions and significant impacts to the power grid. Many outages were the result of frozen equipment at power plants and increased demand. At the peak, on February 16, 4.5 million outages were reported by the U.S. Department of Energy. Outages persisted for days as residents faced temperatures well below freezing and in some cases nearly 40 degrees below average. Rolling blackouts and controlled outages persisted for multiple days in some cases. At least 35 fatalities have been confirmed state-wide, due to a variety of causes including hypothermia, carbon monoxide poisoning and car crashes. A number of injuries have been reported as well, including more than 600 cases of carbon monoxide poisoning in Harris County alone.
Nearly one-third of the state had water supply issues as of Monday, February 22, due to significant pipe bursts and water shortages. Water issues stemming from frozen pipes and power lines, power outages taking water plants offline, and a large number of people leaving faucets dripping impacted millions of residents. Boil advisories were put in place throughout much of the state, impacting an estimated 13 million people, or nearly half of the state, at one point. Throughout the state, pipe bursting has led to significant property damage and flooding. Impacts have been observed in both rural and urban areas. This includes loss of over 325 million gallons of water from a pipe burst in Austin and reported loss of power and water in hospitals. Refineries and petrochemical plants expedited a halt to production, in some cases releasing tons of pollutants into the air.
Southern States
Multiple fatalities have been recorded in other states across the south, including at least 5 in Louisiana, 10 in Tennessee, 3 in Kentucky, 2 in Mississippi, 1 in Oklahoma, and 1 in Arkansas. Widespread power outages were experienced throughout a number of states, including significant numbers in Oklahoma, Mississippi and Louisiana. Water conditions similar to Texas impacted hundreds of thousands of residents across the south, with boil advisories in place in many states. A large boating dock in Tennessee collapsed, forcing 12 people to be rescued. Travel was disrupted as a portion of Interstate 20 in northwestern Louisiana was closed and airports in Jackson, Mississippi were shut down. The CDC has noted delays in the delivery of COVID-19 vaccines, and some states have shut down vaccination and testing centers.
Other Regions
The breadth of this event spread well beyond just southern states, as areas of the Pacific Northwest saw impacts of snow and ice, knocking out power to thousands and disrupting travel in Oregon and Washington. Over a quarter of a million residents were without power in Portland, Oregon as ice accumulating on trees snapped under the weight, leading to downed power lines and transformer blow out. Parts of Interstate 84 were closed in the Columbia River Gorge and regional transit was temporarily suspended.
In the meantime heavy snowfall and freezing rain have affected portions of the Midwest and Northeast, with significant transportation disruption and some property impacts due to downed trees and some roof collapse incidents. Power outages have also been reported for certain areas. Prolonged exposure to extreme cold in the interior has also caused disruption of water systems for either exposed or aging infrastructure in certain areas including those otherwise hardened to extreme cold.
Notable Impacts by Sector

Natural Gas Supply: The Department of Energy reported 20-25 percent of the entire U.S. natural gas production was offline at the peak of the event due to well freeze-offs and natural gas processing plant outages. Well freeze-offs occurred in Texas, New Mexico, Oklahoma and Colorado. Texas gas production was 30 percent lower than pre-event averages. Natural gas fuels 35 percent of power generation in Texas.
Natural Gas Demand: In addition, extreme cold temperatures led to sharp increases in natural gas demand for home heating and electricity generation across much of the Central U.S. Daily demand for natural gas due to the extreme cold resulted in double the average consumption across the Southern U.S. On peak cold days, natural gas demand in in the Southern U.S. was 100 percent higher (double) the pre-event average. Due to the dislocation in supply and demand, spot market prices for natural gas skyrocketed in excess of USD 100/MMBtu, relative to pre-event prices below USD 5/MMBtu.
Renewable Energy: In January 2021, wind power contributed 25 percent of total power generation capacity in Texas, while solar accounted for 2 percent. Wind generation capacity was significantly hampered by icing conditions on turbine blades reducing wind power generation by nearly half on Sunday February 14

ERCOT: The independent system operator for the state of Texas (Electric Reliability Council of Texas) serves 26 million people and 90 percent of the state’s electricity load. The lack of fuel availability severely compromised both power generation capacity from a thermal (natural gas, gas, coal, nuclear) and renewable (wind, solar) perspective. During the month of January 2021, 72 percent of ERCOT power generation was thermal, 27 percent was renewable sourced. ERCOT issued controlled power outages to manage load imbalances commencing February 15, with an energy emergency alert issued on February 16 through February 19. On the peak cold day of February 17, 43,000 MW of energy was offline compared to elevated demand. ERCOT operations returned to normal as of Sunday February 21.
MISO & SPP: The Midcontinent Independent System Operator (MISO) and Southwest Power Pool (SPP) were also adversely impacted by load imbalances due to increased demand and curtailed supply commencing Monday February 15th. Dislocations in supply and demand of electricity resulted in temporary outages in the Plains, Southeast and Southeastern US states where MISO and SPP serve customers.

Full or near-full shutdowns were reported at multiple refineries, accounting for approximately 19 percent of total U.S. refinery capacity. While the worst impacts were seen in the Texas Gulf Coast region, refinery issues extended across multiple states of the Deep South. Shutdown of facilities led to flaring, burning and/or releasing gases to prevent processing unit damage. The five largest refiners emitted nearly 337,000 pounds of pollutants, including benzene, carbon monoxide, hydrogen sulfide and sulfur dioxide, according to preliminary data supplied to the Texas Commission on Environment Quality (TCEQ).

Looking ahead to rebuilding efforts, key commodities, namely lumber, iron and copper, have already seen meaningful price increases over the last 12 months. The U.S. Department of Labor indicates softwood lumber used to frame houses doubled in price from April 2020 to January 2021 to nearly USD 1,000 per thousand board feet. Copper supplies are the tightest in a decade while prices nearing USD 10,000 per ton are 17 percent higher in 2021 alone. Copper prices have rebounded by 100 percent since the depth of the COVID-19 financial crisis with current prices the highest seen in ten years. Steel prices have followed a similar trend and are currently 160 percent higher than August 2020. Global trade ramifications also see U.S. steel prices currently trading at a 70 percent premium to market prices in both China and Europe.

In conjunction with rising commodities prices, skill labor availability is a concern. The U.S. construction industry employs 5 percent of the nations’ workforce at 7.3 million employees. While unemployment nationally rose to near 15 percent during the height of the COVID-19 pandemic, there was little to no rise in the number of unfilled construction jobs, ranging from 223,000 to 332,000 nationally. The shortage of skilled laborers for plumbing, carpentry, electrical and roofing work is driving wage increases and costs higher for building, repairs and renovations. Half of America’s skilled trade laborers are expected to retire within the next ten years. Meanwhile, demand for electricians, carpenters and plumbers is expected to increase by 8-14 percent over the next decade. The National Association of Home Builders identified that labor shortages are the top concern for the industry. 85 percent of members voice their top concern as future cost and availability of labor, a major increase from only 13 percent of members identifying this as a top concern ten years ago.
![]()
Operations were significantly hampered in the Houston Ship Channel due to freeze offs impacting refineries and terminals. On February 16, there were 13 vessels waiting to depart and 18 ships in the queue to enter Houston. Rail operations impacts were widely seen across the country. CSX terminals closed in Nashville, TN, Richmond, VA, Wilmington, DE and Baltimore, MD. Kansas City Southern indicated rail delays across Texas, Louisiana and Mississippi are likely to extend over a week due to delayed service restoration. Union Pacific operations were heavily impacted in the Chicago metroplex as well as Louisiana and Texas rail lines with the decision to close all of its intermodal operations to avoid equipment imbalances across their network.

Both Samsung and NXP Semiconductors slowed semiconductor production in Austin, TX due to power grid disruptions. Shortages in semiconductor availability, in place prior to the Arctic outbreak, are further exacerbated by the delays in Texas. An industry notably hit by the scarcity of materials is the automotive sector. General Motors, Volkswagen and Audi highlighted delays in automobile delivery from Mexico due to natural gas shortages in conjunction with semiconductor shortages and delays.

The produce corridor of Texas along the Rio Grande River Valley suffered irreparable freeze damage to citrus and vegetable crops. 35 types of fruits and vegetables are grown across the region, including grapefruits, oranges, avocados, cabbage, onions, sugarcane and watermelons. Further north in the Central/Southern Plains, bitter cold temperatures across the hard red winter wheat belt transpired over some acreage without protective snow cover. Full damage assessment will become evident over the next several weeks after moderation in temperatures.
Initial Industry Assessment
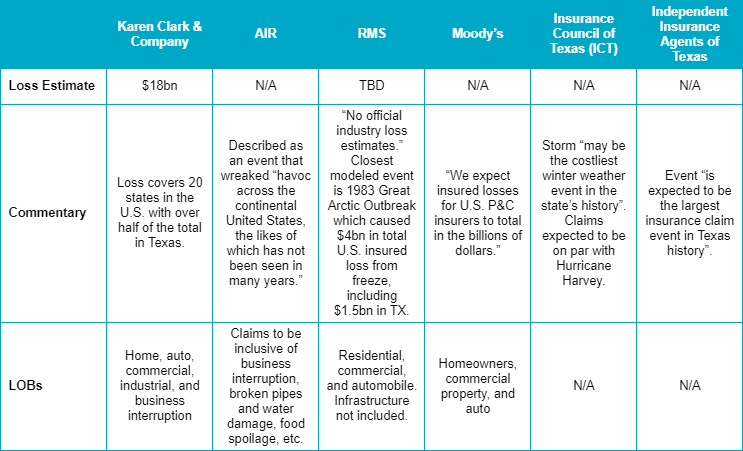
Catastrophe modeling vendor KCC has issued a revised estimate of USD 18 billion of insured losses, revised upwards from an initial estimate of USD 10 billion during the middle of the Arctic outbreak. RMS plans to issue additional guidance in late February or early March. Other entities offering opinions on potential losses are shown in the chart below.
The probable heavy winter storm loss in Q1 draws into question what to expect for the balance of 2021. With a weakening La Nina and warm sea-surface temperatures in the tropics, elevated severe-thunderstorm activity and near to above normal hurricane activity seem most probable for the balance of 2021 (see more in the physical discussion below).
Key Dates in U.S. Arctic Air Outbreak
Physical Discussion
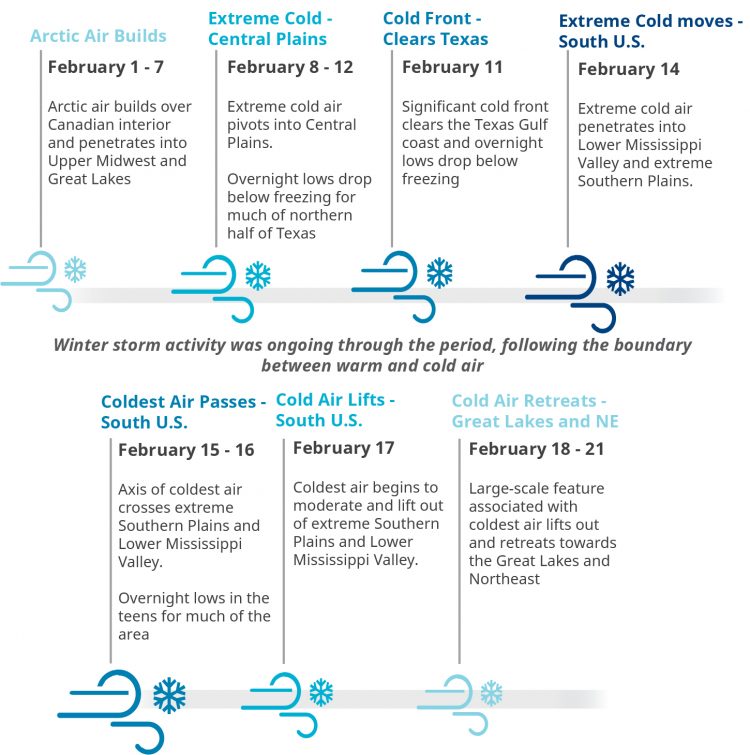
The general timeline of the February Arctic outbreak is shown above, following analysis of weather archives available from the NOAA Weather Prediction Center. This outbreak and associated winter weather activity has taken on different forms from region to region. The scope, severity, duration and onset dates of resulting impacts also varies from region to region. With this context, the outbreak was notable in several respects.
Prolonged Cold
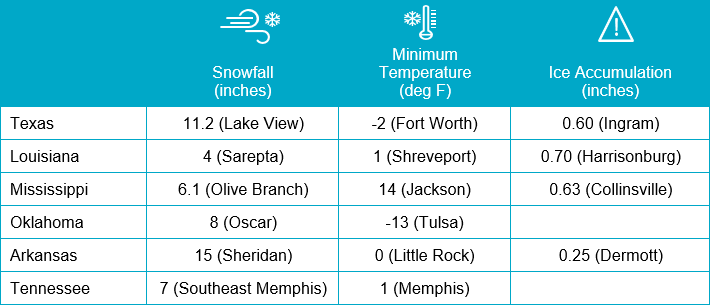
The weather patterns in play allowed deep arctic cold air to drain clear to the Northern Gulf Coast and into Mexico. All-time record cold temperatures were set in locations including Imperial, NE (-39 F) and tied in Fort Worth, TX (-2 F). Well below freezing temperatures affected the Gulf Coast states, with disastrous effects to water infrastructure in the area, compounded by effects to power infrastructure in the region. In the meantime locations in the Midwest and Northeast also suffered periods with prolonged temperatures well below 10 F, with localized effects to water infrastructure even those already resilient to cold. The interior record cold was associated with unusually warm temperatures and an upper-level high over the western continent including Alaska, and circulation patterns in the extreme north associated with a negative phase of the Arctic Oscillation. [caption id="attachment_54540" align="aligncenter" width="750"]
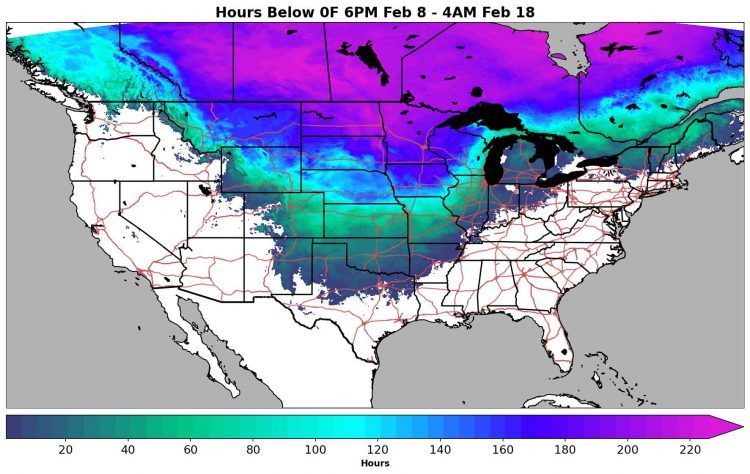
Hours below 0F between 6PM EDT February 8 and 4AM EDT February 18. Source: RiskPulse.[/caption]
Winter Weather
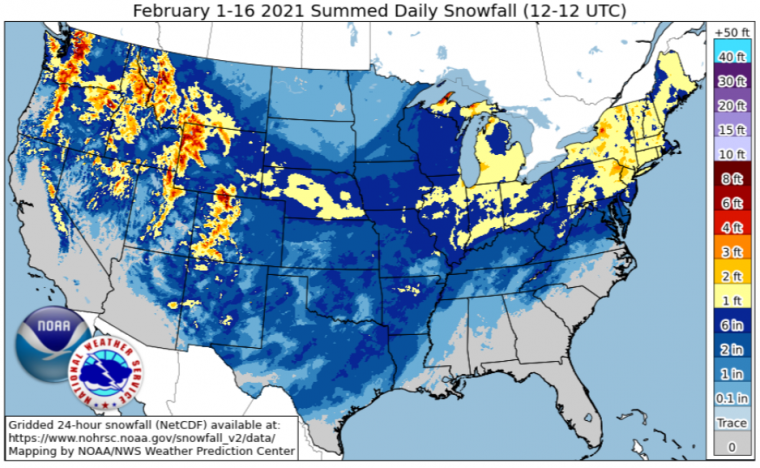
The intrusion of deep arctic cold met warmer air from the Gulf of Mexico along a boundary that crossed from the Southern Plains to the Mid-Atlantic and Northeast. Several weather systems formed along this boundary and followed the sharp boundary. Each weather system produced a mixture of freezing rain, sleet and heavy snow over a large area. These storms rendered significant effects to transportation, with impacts also for property due to treefall and roof collapse under heavy snow. One of these storms, unofficially named “Uri” by the Weather Channel, rendered especially severe impacts in the Southern Plains and Lower Mississippi Valley. [caption id="attachment_54541" align="aligncenter" width="595"]
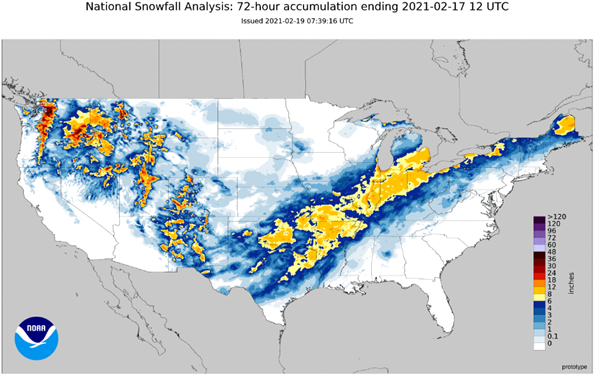
National Snowfall Analysis for 72 Hours Ending 7AM EDT February 17. Note impactful snowfall from the Southern Plains to the Great Lakes and Northeast. Source: NOAA/NOHRSC.[/caption]
Implications for ‘21 Cat Year
Looking Forward to the Balance of 2021
Arctic outbreaks of this severity are very rare, and it is difficult to determine meaningful associations with extreme events during the spring/summer months. However, we are in a La Nina phase, and this is typically associated with elevated tornado activity in the Central Plains and Mississippi Valley as shown below. (Allen et al 2015).
Moving into the summer months, the La Nina is expected by the U.S. Climate Prediction Center to relax to ENSO-neutral conditions for the heart of hurricane season. In the meantime sea-surface temperatures in the Atlantic tropics remain elevated. In view of these factors, the seasonal forecast for 2021 is for near to above average hurricane activity in the North Atlantic Basin, according to Phil Klotzbach of Colorado State University. [caption id="attachment_54542" align="aligncenter" width="705"]
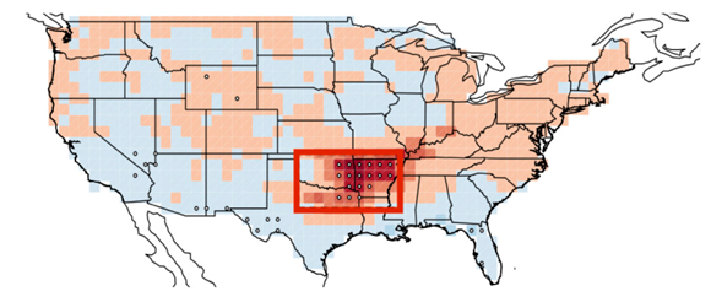
Effect of La Nina on SCS Activity. Red shades indicate associations with increased activity. Source: Allen et al., 2015.[/caption]
Climate Context
This is a very similar meteorological setup to December 1983, where exceptionally cold arctic air was able to drain into the interior, bringing severe cold to the deep Southern Plains, with pipe fracture and power infrastructure issues. The population of Texas has more than doubled since then. Single events are often challenging to attribute to climate change, and this is especially true with extreme events. However, under global warming the best scientific view is that weather systems should slow down, bringing prolonged conditions to an area (warm, wet, stormy, snowy, extreme cold). This would bring perhaps a slight change to the means, with a thickening of the tails for such events, consistent with the best scientific view on the issues.
Resilience Measures
The Insurance Institute for Business and Home Safety maintains a number of good recommendations to improve resilience to winter weather hazards. Protective measures against extreme cold and pipe fracture, roof collapse under excessive snowfall, and even for ice-damming effects can offset winter weather impacts. These measures are discussed at the link below:
https://ibhs.org/guidance/winter/
Selected Peak Meteorological Statistics
Sources: Reuters, Department of Energy, Associated Press, Freightwaves, U.S. Weather Prediction Center, U.S. National Climatic Data Center, U.S. Weather Prediction Center, BBC, Austin American-Statesman.