

Download the Full Briefing
January 2022 Reinsurance Renewal: An Evolving Market Leads to Divergent Outcomes
January 1 renewals reflected a healthy but evolving market as reinsurers adjusted risk appetite and pricing thresholds for certain sectors in response to ongoing and emerging challenges. Despite this, the majority of placements were ultimately orderly once cedents’ terms were issued, as market participants effectively traded through a dynamic environment.
The sector once again proved its ability to evolve and grow to meet an ever-changing risk landscape.
Key Findings
- The most significant macro influences at renewal included climate change, core inflation, social inflation, continued underlying positive rate change across most lines of business, and continued evolution of the frequency and severity of catastrophe loss.
- Reinsurers continued to expand their differentiation of each client's unique placement characteristics. These include a view of underlying risk, loss experience, claims performance, strength of management, business strategy, perceived adequacy of pricing and structure, and depth of the client relationship.
- Conditions were bifurcated between non-loss-impacted and loss-impacted programs.
- Capacity was ample for many lines but more constrained for retrocession and some components of property, including loss-impacted lower catastrophe layers and aggregates. Capacity for cyber aggregates was also limited.
- The property renewal process ran up to 14 days behind typical timing, creating a flurry of activity with two weeks (and fewer working days) left in the year. Key drivers of the later renewal included shifting risk views impacting pricing models and capacity allocations, uncertainty around trapped capital/loss estimates and a very late retrocession renewal.
- Casualty renewals were generally orderly, with pressure seen in several pockets, including cyber aggregate, clash and loss-impacted excess of loss programs.
- The Guy Carpenter Reinsurance Composite index is on track to deliver a combined ratio below 100% for 2021 and a projected reinsurer return on equity of near 10%, even after accounting for over USD 100 billion of global large loss.
- The Guy Carpenter Global Property Catastrophe Rate-on-Line Index increased 10.8%.
Key Renewal Commentary
Property
- As clearly evidenced throughout 2021, advanced preparation and planning were critical to achieving satisfactory renewal outcomes. Identifying key renewal drivers and alignment of partner appetite led to better pricing and capacity allocations.
- Overall, there was sufficient capacity to complete programs, with more market appetite for non-loss-impacted upper layers. Capacity was more constrained on lower layers, aggregates, multi-year and per risk, particularly if loss-impacted, as reinsurers reassessed risk appetite and inflationary impacts.
- Inflation was a critical and technical part of negotiations. Insurers providing validation that inflation adjustments were already well-reflected in their rate modifications and insurance-to-value increases ultimately experienced minimal additional impact.
- Individual cedent differentiation was apparent for both non-loss and loss-impacted accounts in both pricing and capacity allocation outcomes.
- While pricing exhibited a wide range on a risk-adjusted basis, non-loss-impacted business was generally flat to up 7%, with loss-impacted up 10% to over 30%.
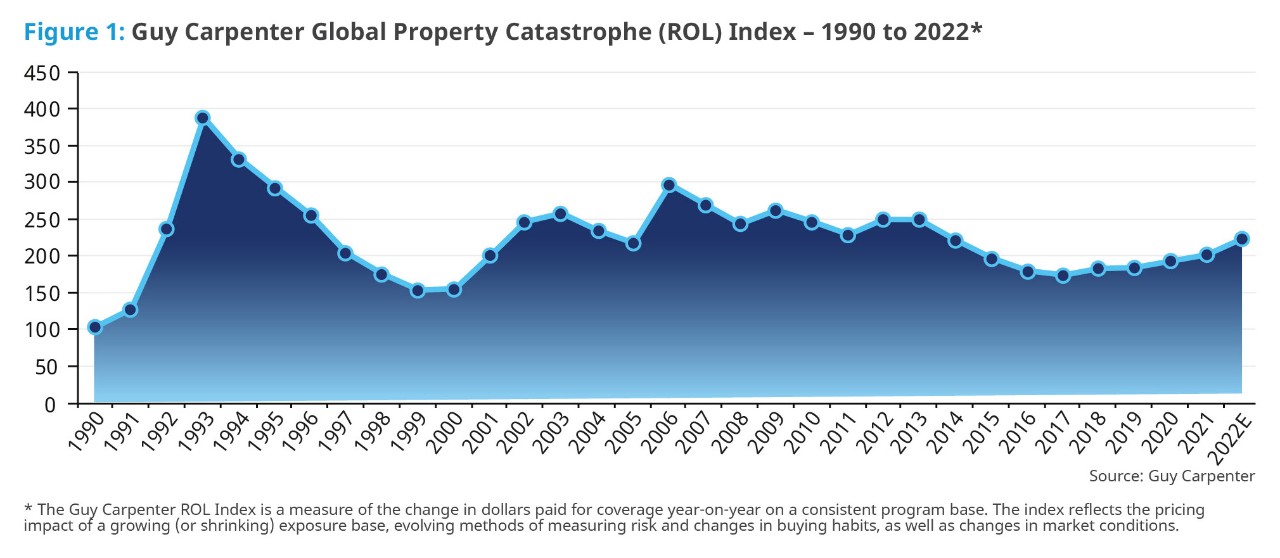
- The Guy Carpenter Global Property Catastrophe Rate-on-Line Index increased 10.8% year-on-year. Structure adjustments, particularly on retentions, were more prevalent in heavier loss-impacted sectors.
Retrocession
- In another year affected by catastrophe events, property retrocession renewals experienced price increases in aggregate and occurrence products, with the largest changes in loss-affected accounts as well as low-lying aggregate placements following reductions in available capacity.
- There was a material variance in pricing depending on loss experience in 2021 and for aggregate contracts in particular, loss history became a much more dominant pricing metric than in prior years.
- The effect of this on buyers was to see some increased retentions and a greater prevalence of occurrence structures where capacity was more readily available at a price.
- Capacity was less restricted for direct and facultative catastrophe covers than for retrocession, although it experienced some similar dynamics with reinsurers typically looking to move from frequency areas of programs.
Casualty
- Continued positive underlying rate movement across casualty lines factored heavily into renewal outcomes, as prospective loss ratios showed continued improvement.
- Another important consideraton in reducing loss projections is ongoing underwriting discipline. Factors include limits management and tighter underlying policy terms and conditions.
- These improvements drove quota-share ceding commission increases ranging from flat to up 1.5 points for excess casualty and flat to up 2.5 points on financial lines. For cyber, rate improvements were viewed as an offset to ransomware concerns, making flat ceding commissions common.
- In contrast to pro rata placements, casualty excess of loss programs saw a continued reinsurer push for margin improvement after years of competitive market pricing and volatile results.
- Loss-impacted renewals were the most challenging and experienced some panel turnover.
- Casualty renewals were orderly, with any delays being driven by general market lag as well as negotiations across placements.
- Casualty capacity was generally sufficient. However, outcomes ranged widely based on casualty line and capacity requirements. Financial lines benefited from the healthiest reisnurer appetite, with cyber aggregate being the most challenged.
- Early distribution of detailed, high-quality underwriting information together with a broad and effective marketing stretegy were highly influential in an effective placement process.
Specialty
Aviation
- Airline insurers have had to be nimble with their income forecasts as they were faced with many variables, including rate expectations and flying customer volumes. The general aviation and aerospace markets have been relatively unaffected by COVID-19.
- After two years of increases, reinsurers priced as before or slightly higher (up 2.5%) as an average across programs on a risk-adjusted basis. Profitable treaties received minor increases in commissions. Space clients completed their panels with relative ease at January 1.
Trade Credit
- Low loss ratios and lower than forecasted claims led to reinsurance capacity from incumbent markets exceeding demand for programs. Therefore, opportunities for new entrants were limited.
- As expected, cedents regained price movements at January 1 with proportional treaty ceding commissions increasing, and risk-adjusted improvements realized for excess of loss programs.
Marine
- Any claims activity was price-sensitive, and the South African riots led to some restructuring of select composite programs with more specific terror coverage being purchased.
- Overall, reinsurers maintained underwriting and structure discipline. There was plentiful capacity when pricing was deemed adequate, with new entrants having a limited impact at January 1. Internationally, pricing was at the lower end of pre-renewal expectations to flat, with the London markets having a mild hardening with increases in cash spend of approximately 3% to 6%.
Download the Full Briefing
January 2022 Reinsurance Renewal: An Evolving Market Leads to Divergent Outcomes
Market Drivers
Despite significant market losses, dedicated reinsurance capital continues to increase to meet the industry's needs.
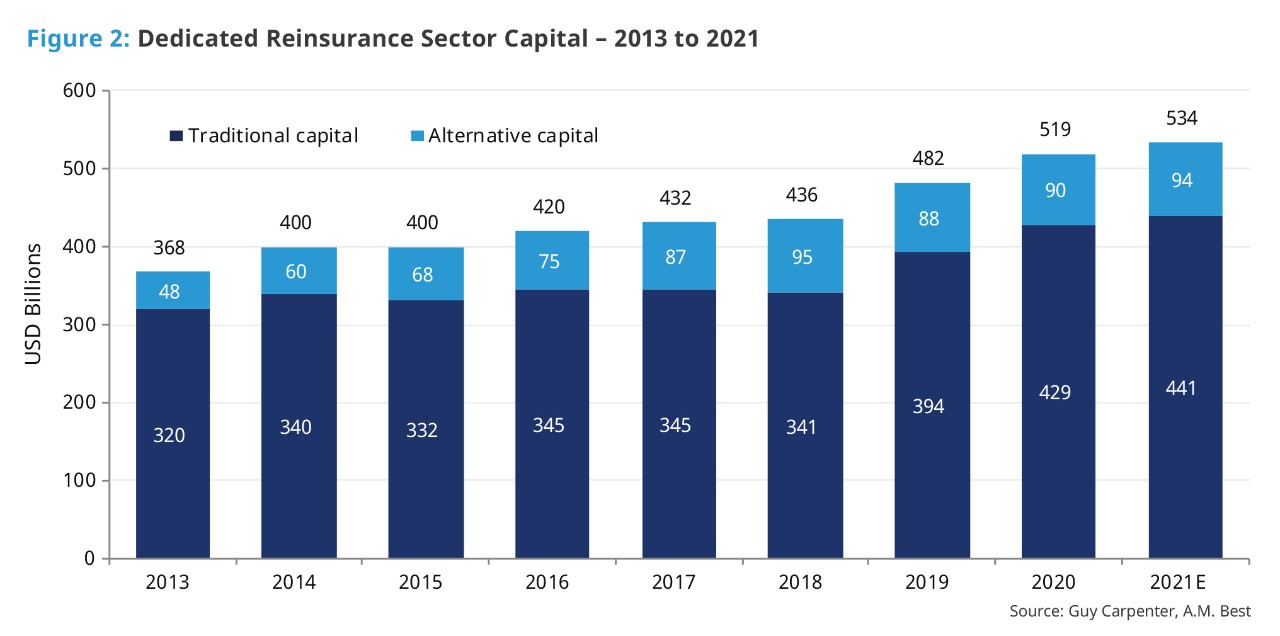
- Guy Carpenter and A.M. Best estimate total dedicated reinsurance capital at USD 534 billion, a 2.8% increase from year-end 2020. Traditional and alternative capital increased 2.7% and 3.7%, respectively. This is total committed capital and does not reflect a decrease in currently available capital due to funding obligations. Guy Carpenter estimates that this “trapped” capital is less than 5% of overall dedicated reinsurance capital.
- The weighted average combined ratio for the Guy Carpenter Reinsurance Composite improved by 4.7 points to 98.7% for the first nine months of 2021 compared to full-year 2020’s 103.4%. It is on track to finish below 100% for 2021, despite elevated catastrophe activity.
- Reinsurer premium growth was seen across most lines of business due to a combination of escalating rates as well as a charge for increased exposures driven significantly by inflation adjustments. Composite return on equity for the first nine months was 10.1%, improved from 2020’s 3.2%.
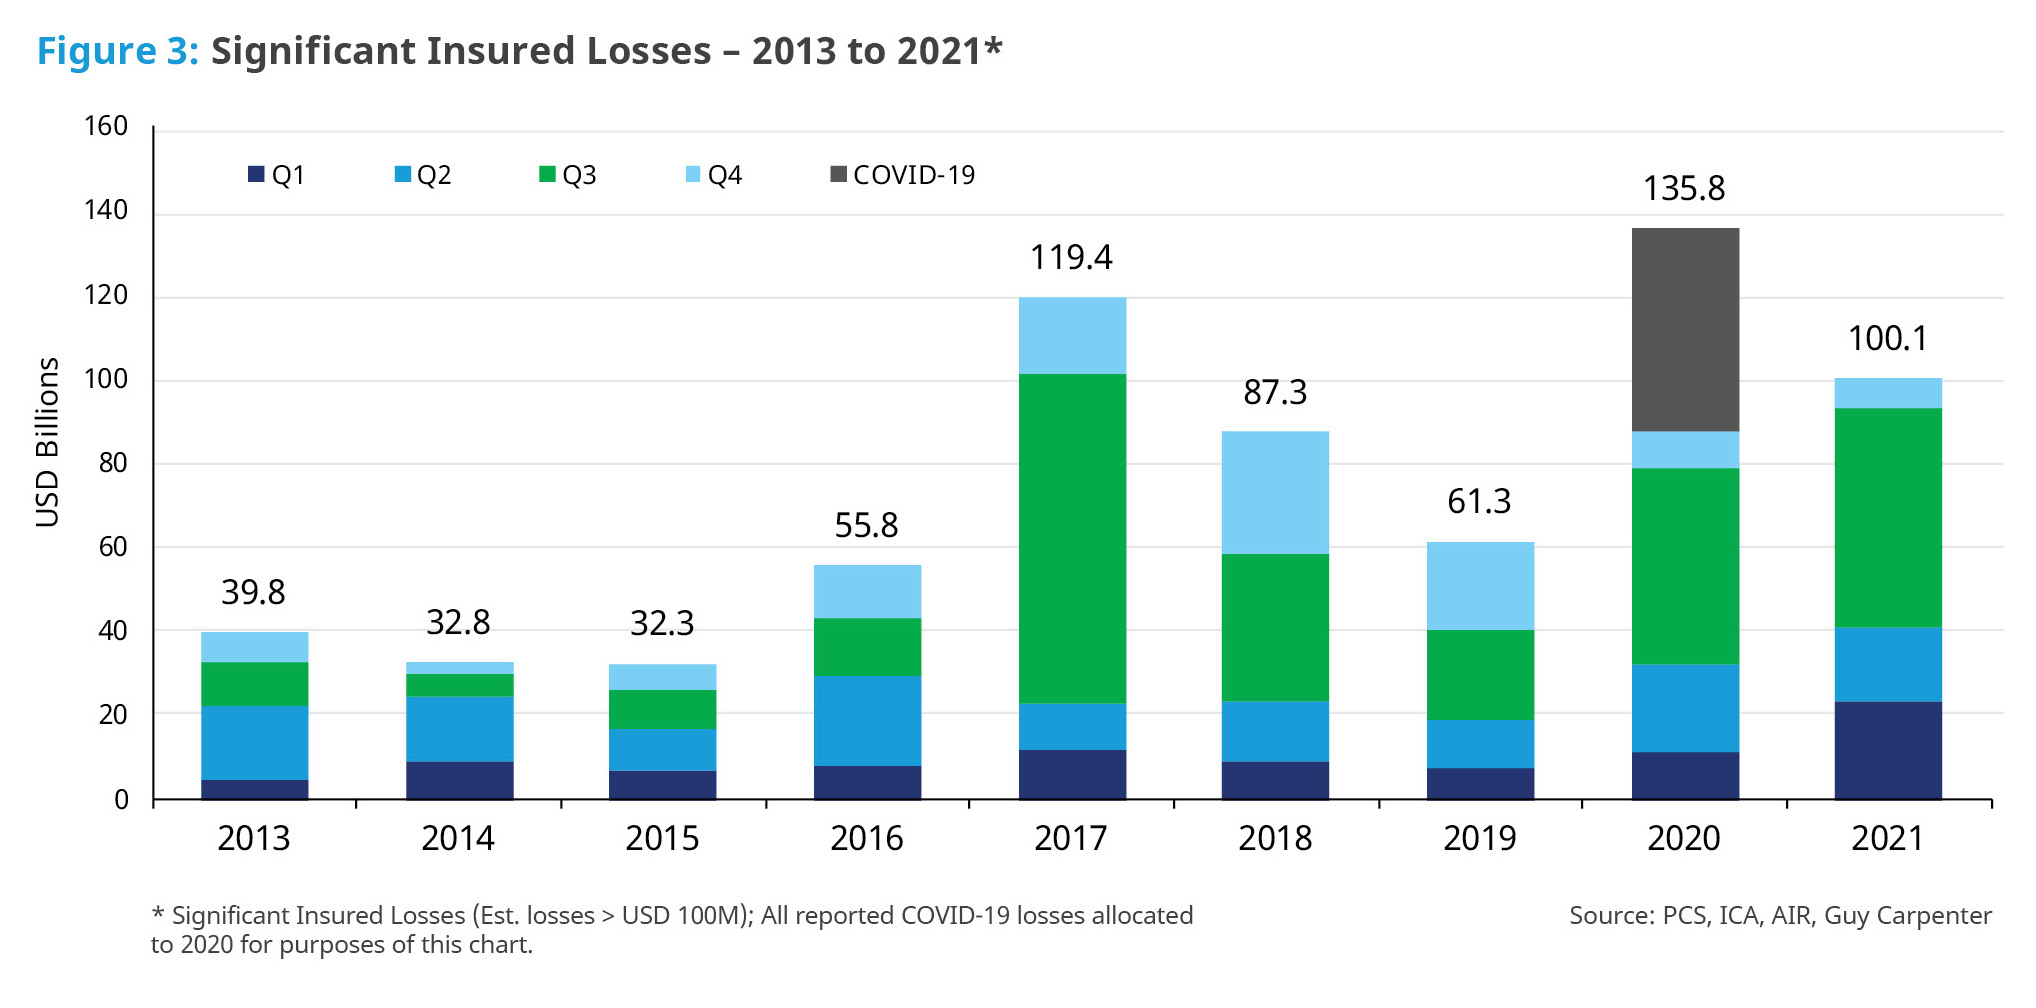
- The projected annual large loss total rose to over USD 100 billion with the fourth quarter severe storms in the US. This total includes nearly USD 30 billion of estimated loss for Hurricane Ida. Based on a survey of insurers’ current ultimate loss projections, this is a conservative estimate.
- The publicly available reported total ultimate COVID-19 loss estimate is now at USD 48.2 billion. A significant amount of this total – USD 18.9 billion (approximately 39%) – remains incurred-but-not-reported, and the majority of 2021 reported development was life business.
- The European floods, Hurricane Ida, and US severe storms drove 2021 loss experience.
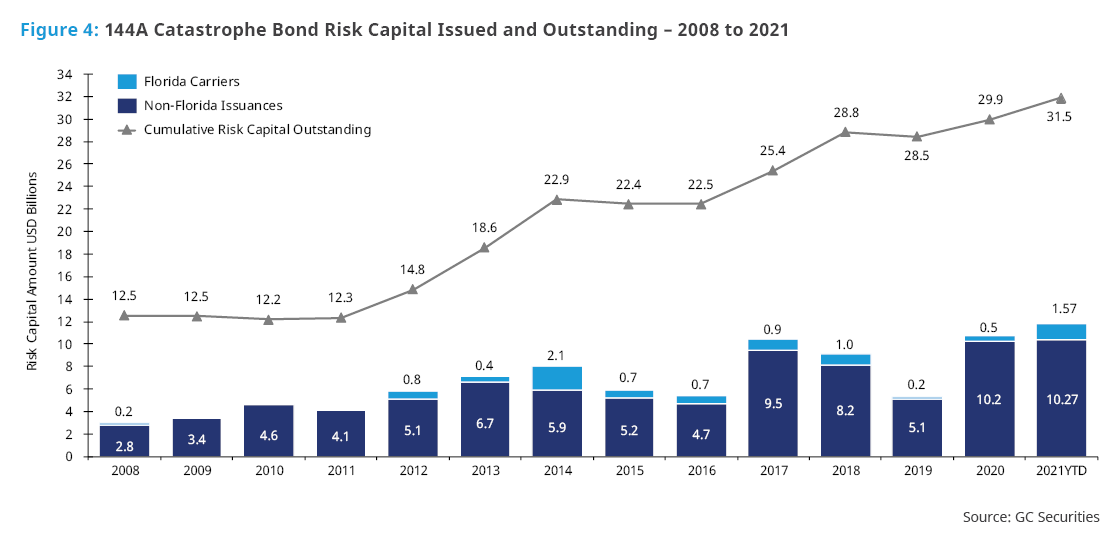
Catastrophe Bonds
- The catastrophe bond sector had a record year. In 2021, 45 different bonds were brought to the 144A market for over USD 11.5 billion in limit placed, taking the total outstanding notional amount to over USD 31 billion.
- In view of constrained retrocessional capacity, global reinsurers found industry loss index based multi-year, multi-region and multi-peril aggregate covers available in the bond market to be especially attractive.
- Over 70% of the limit placed had an indemnity-trigger structure, with the balance coming from industry loss index and parametric structures.
- The sidecar market has been challenged, with several insurance-linked securities managers withdrawing their capacity.
- A significant majority of the bonds priced at or below the lower end of the price guidance, in view of strong demand from investors.
Looking Ahead
- Emerging risk factors, including climate change, cyber threats, core inflation and social inflation, will continue to influence reinsurers’ approach to pricing and capacity allocations. It is clear from January 1 activity that strategies regarding how to account for these factors are evolving and varied. Cedents’ views, particularly when supported by portfolio data, will be a critical component of renewal outcomes.
- Environmental, Social and Governance (ESG) continues to grow in importance for key stakeholders and is seen as not only a positive conduit for change, but also as an indicator of financial outcomes. While not yet explicitly impacting capacity or pricing broadly, there is a noticeable increase in reinsurer interest, with some indicating that changes to the overall underwriting process and partner selection relative to ESG criteria are coming.
- Innovation and adaptation to the changing risk landscape remain the hallmark of the (re)insurance sector. As new technology emerges, InsurTechs will remain an extremely active market in 2022.
- Data insights, product innovation and enhanced market intelligence will fuel ongoing market evolution. Guy Carpenter’s depth of market presence and investment in people and infrastructure provide the necessary foundation to identify and navigate current and future challenges.
References & Endnotes can be found in the PDF.
Download the Full Briefing
January 2022 Reinsurance Renewal: An Evolving Market Leads to Divergent Outcomes