Key Headlines
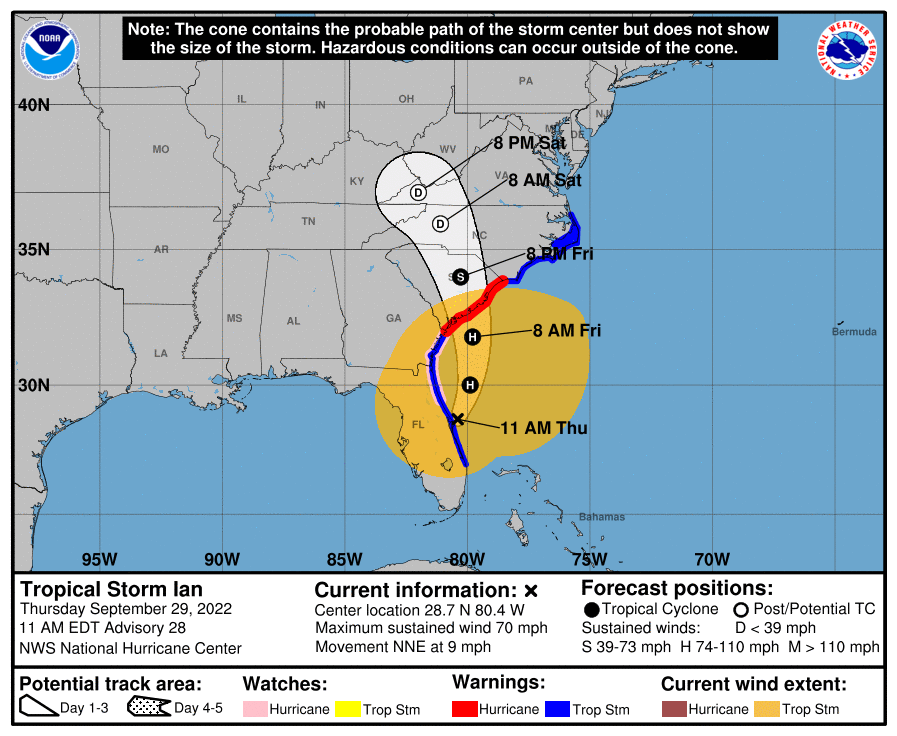
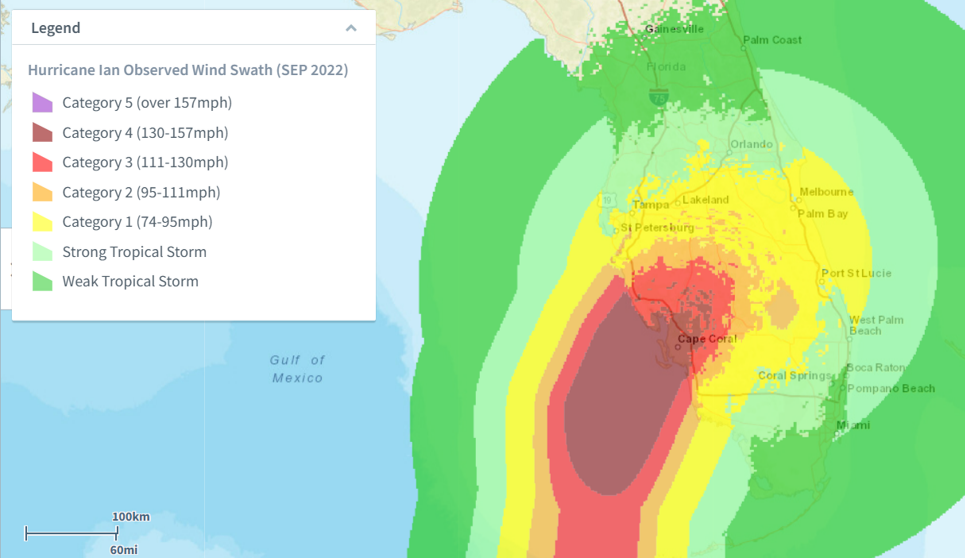
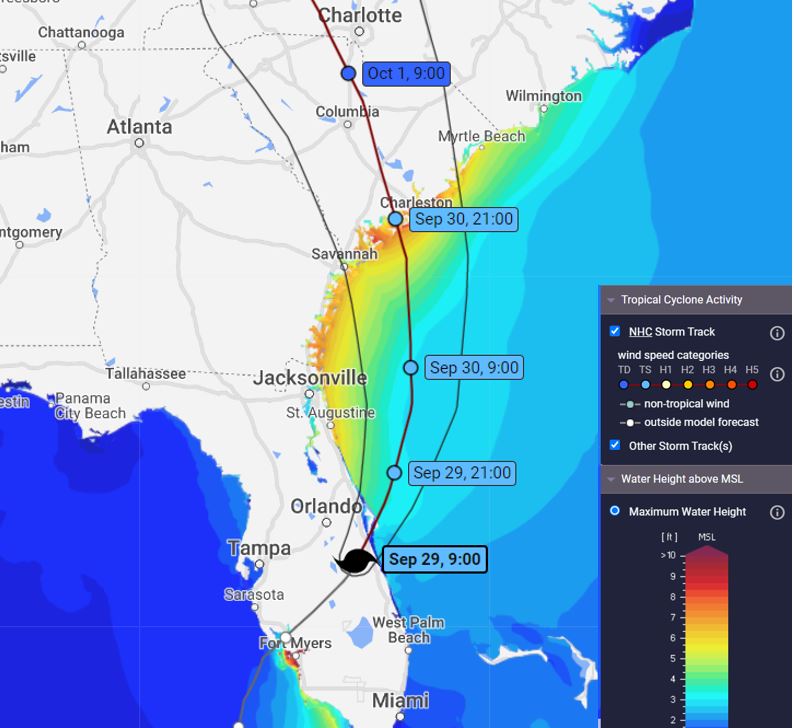
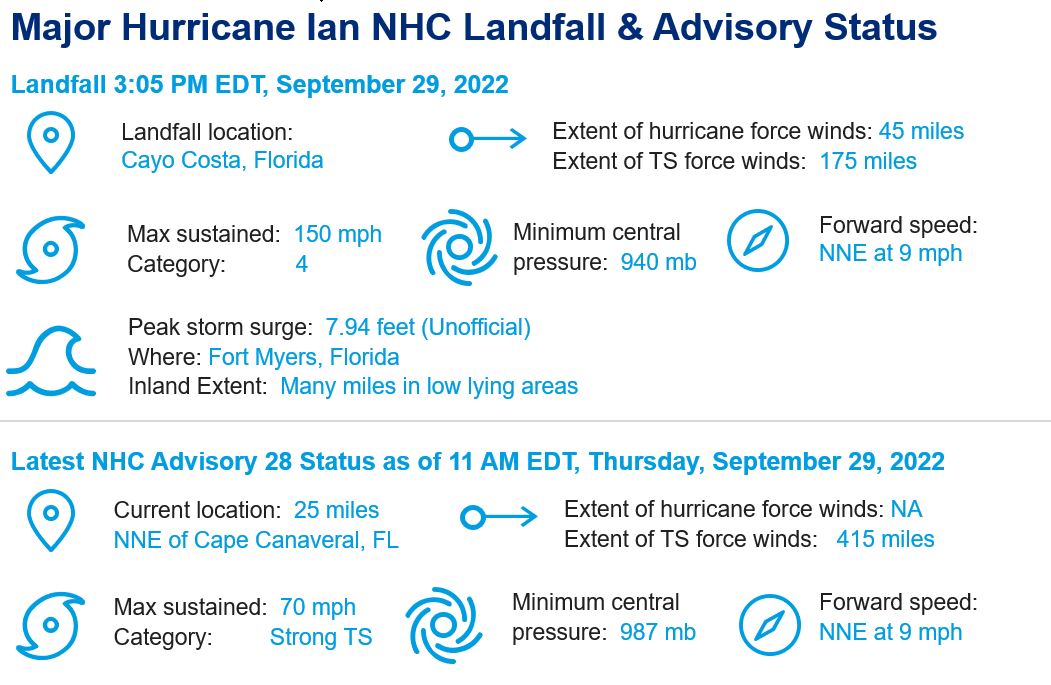
- According to the National Hurricane Center (NHC), Hurricane Ian made landfall at 3:05 PM EDT September 28 near Cayo Costa, Florida. Maximum sustained winds at landfall were 150 mph as a high-end category-4 hurricane on the Saffir Simpson Scale.
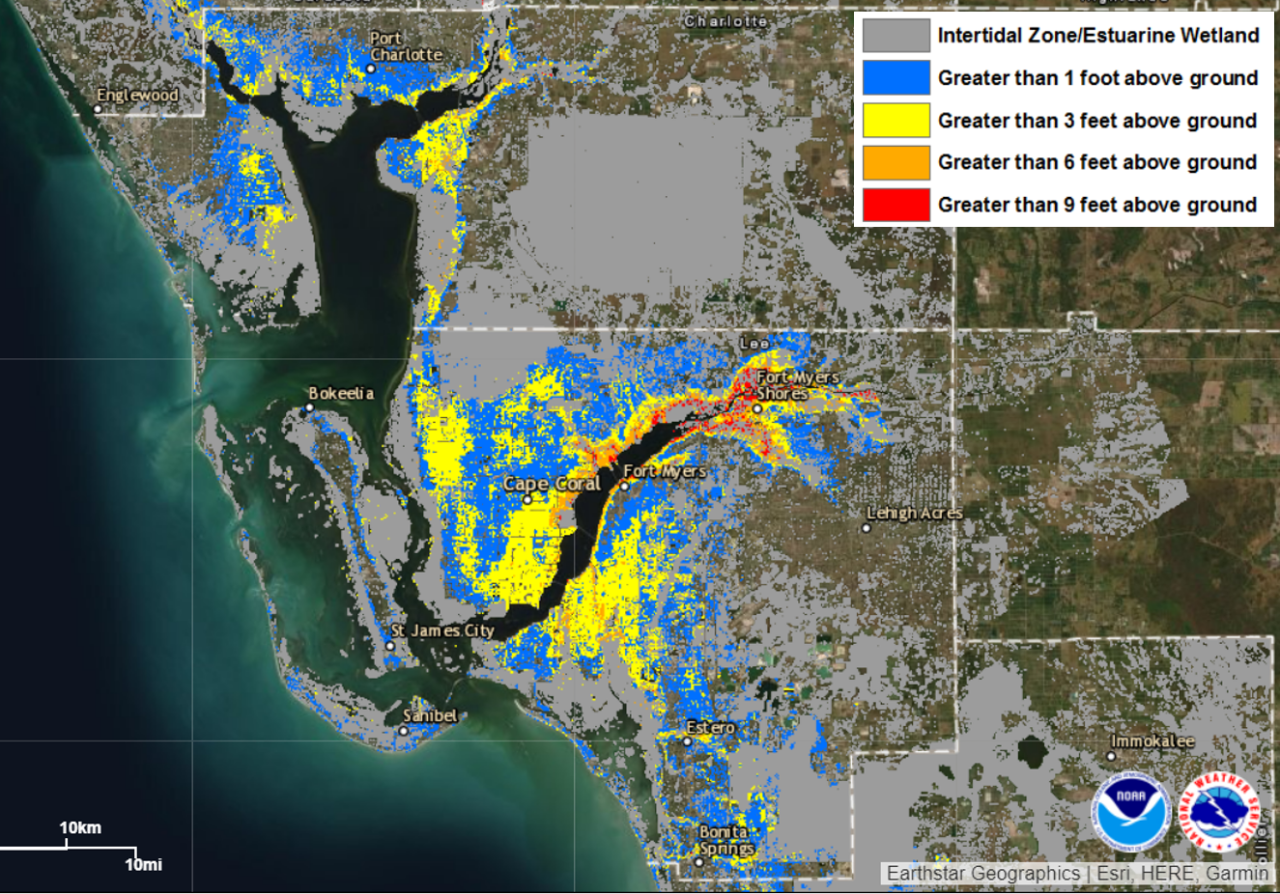
- Ian is among the strongest hurricanes to make a Florida landfall in recorded history. Initial media reports indicate catastrophic damage to property and infrastructure in Charlotte County and surrounding areas from severe wind damage, freshwater flooding, and most notably from seawater inundation from a possible record storm surge with levels in excess of 7 feet.
- Ian has since been downgraded by the NHC to tropical storm status and has cleared the Florida Atlantic Coast. Tropical storm force winds, excessive rainfall and storm surge remain as ongoing threats. Watches and warnings remain active per the NHC, with specifics available at www.nhc.noaa.gov.
- Ian is forecast by the NHC to briefly move over the western Atlantic before making final landfall in South Carolina Friday afternoon, most likely as category-1 hurricane.
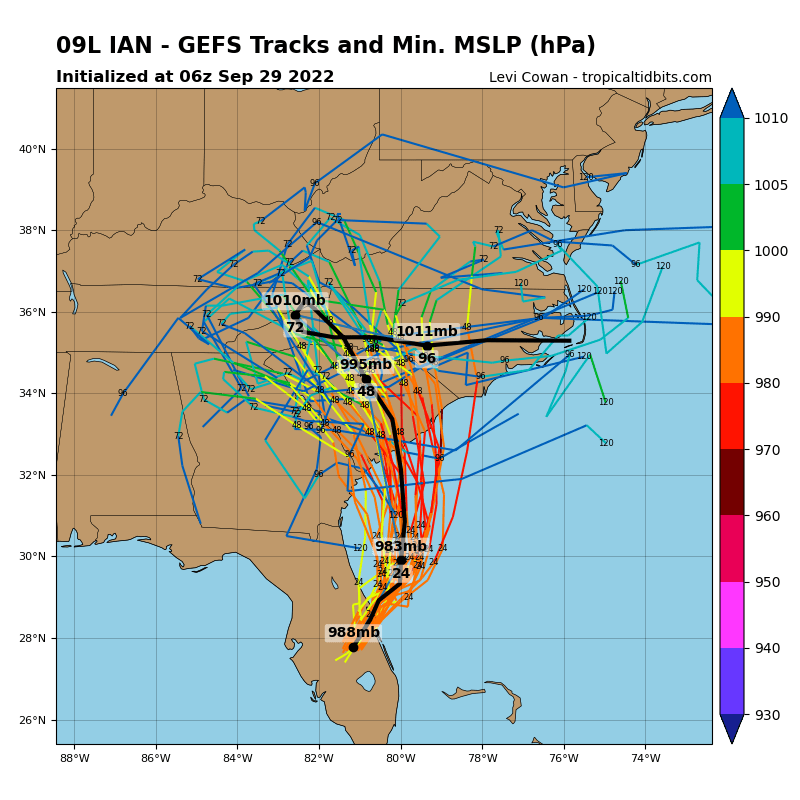
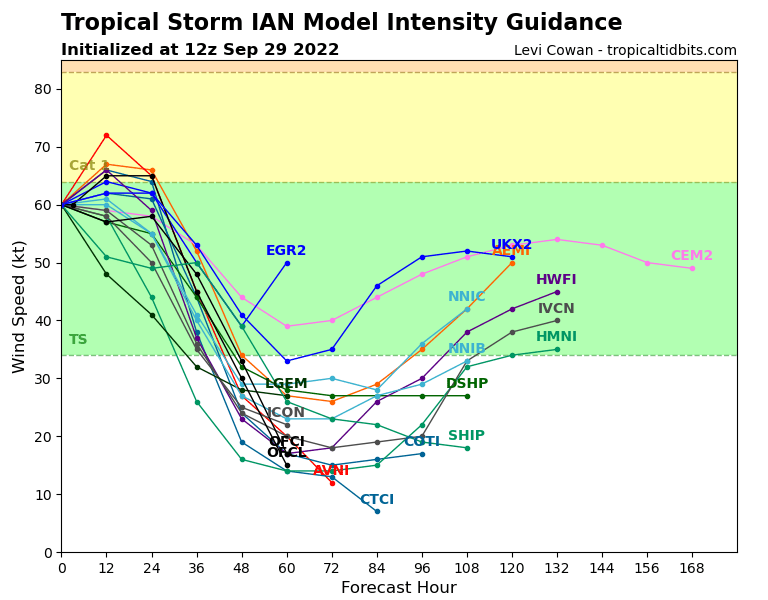
What Is the Forecast For Ian’s Final Days?
Ian is now a tropical storm, moving northeastward from the Florida Peninsula. The large scale weather patterns support a gradual turn to the north and eventually northwest on Friday. Ian will be moving over the warm 28-29 degree Celsius waters of the Gulf Stream with additional support from interaction from a frontal system approaching from the Mainland, but counteracted with some wind shear. This scenario favors a final landfall at hurricane intensity somewhere in South Carolina within 36 hours. The risk for impacts to the region include life-threatening storm surge inundation, flooding rains, isolated tornadoes and category-1 hurricane winds. The combination of storm surge and rainfall could produce areas of flash flooding and urban flooding as the storm moves inland.
What was Unique About Ian’s Storm Surge?
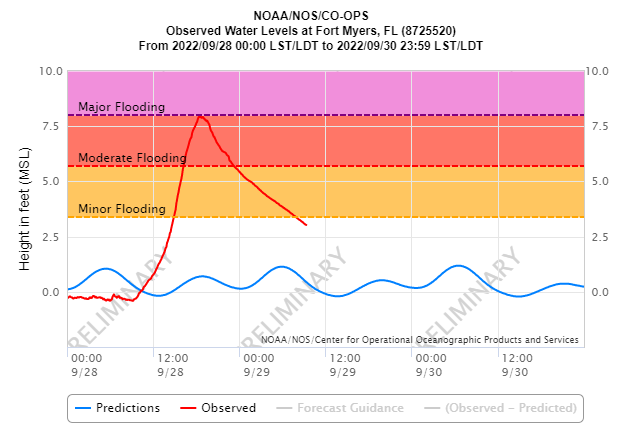
Hurricane Ian came onshore with a devastating storm surge along Florida’s southwestern coast. In Naples, FL, a gauge measured 7.1 feet before it failed at 1 pm EDT. Higher surge elevations would have occurred after the failure, placing the location well above NOAA’s ‘Major Flooding’ level. In Ft. Myers, the gauge crested at 7.94 feet, which is just shy of the ‘Major Flooding’ threshold. These are possibly record-setting values. Further north along the coastline, there was a 7 foot draw down of water in Tampa Bay, as offshore winds pushed water out to sea.
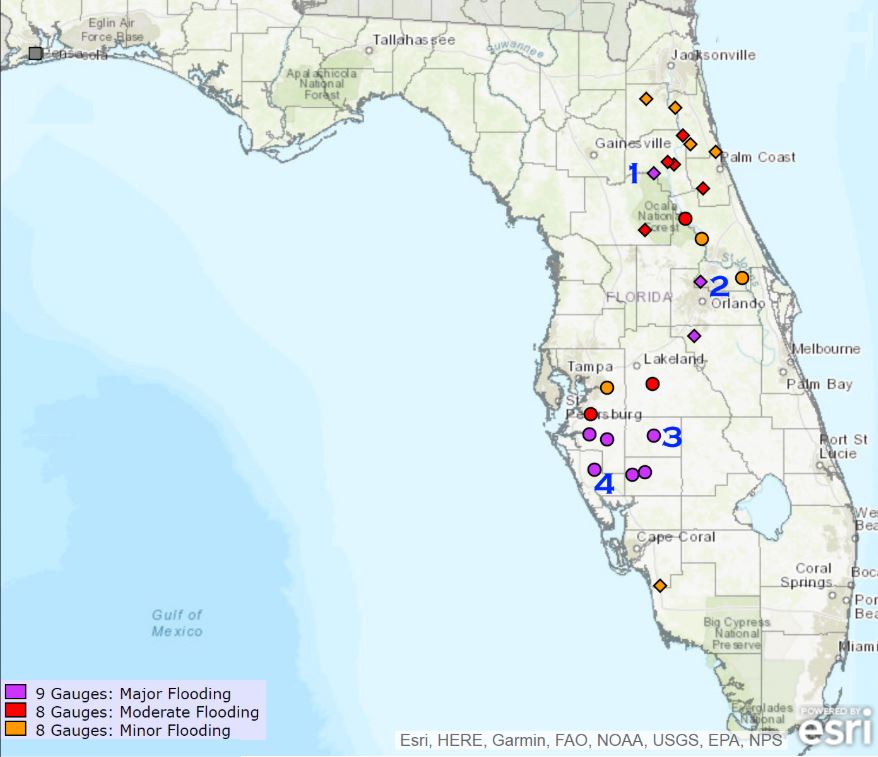
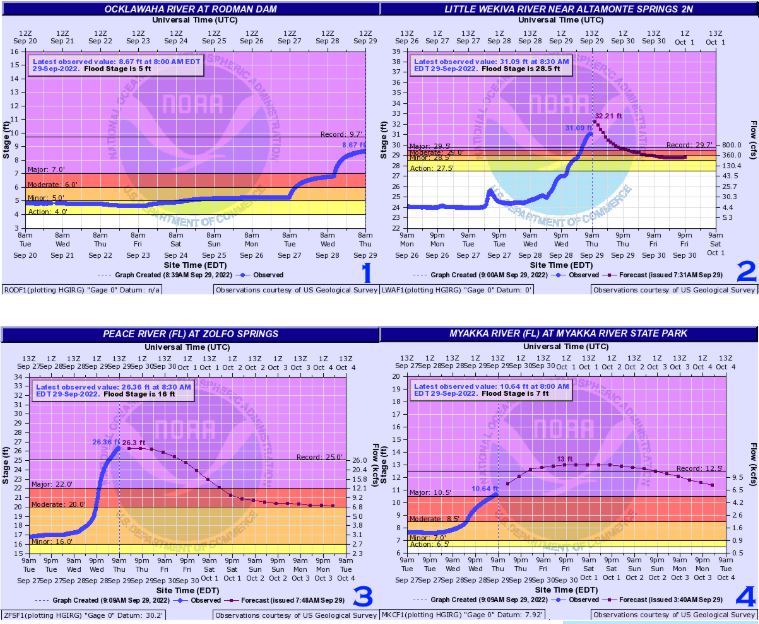
How Severe Was the Inland Flooding?
In addition to storm surge in coastal locations, record rainfall amounts are causing river flooding across the state. Over 25 gauges are already in flood stages. Some locations are reaching “Major Flooding” stage and will likely surpass all-time records. Impacted areas included Northeast FL, Orlando, and along Peace Rivers in Hardee, DeSoto and Charlotte Counties.