Header

Live Event: Category-3 Ian to Bring Major Impacts to the West Coast of Florida

Hero image

Key Ian Headlines

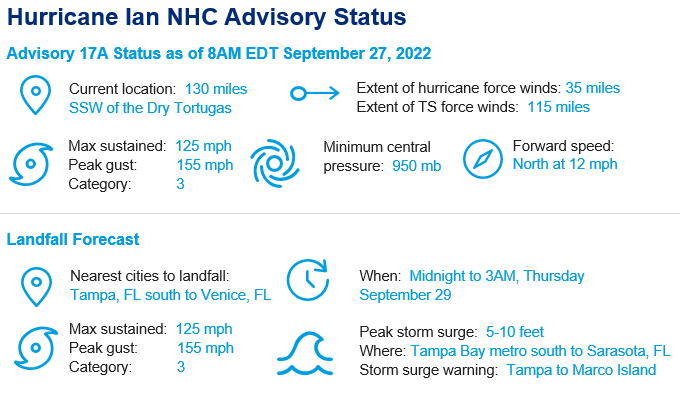
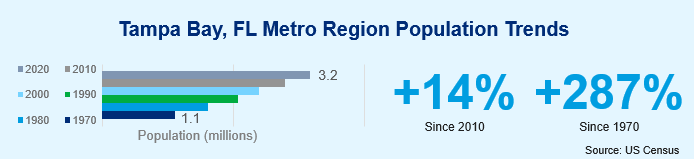
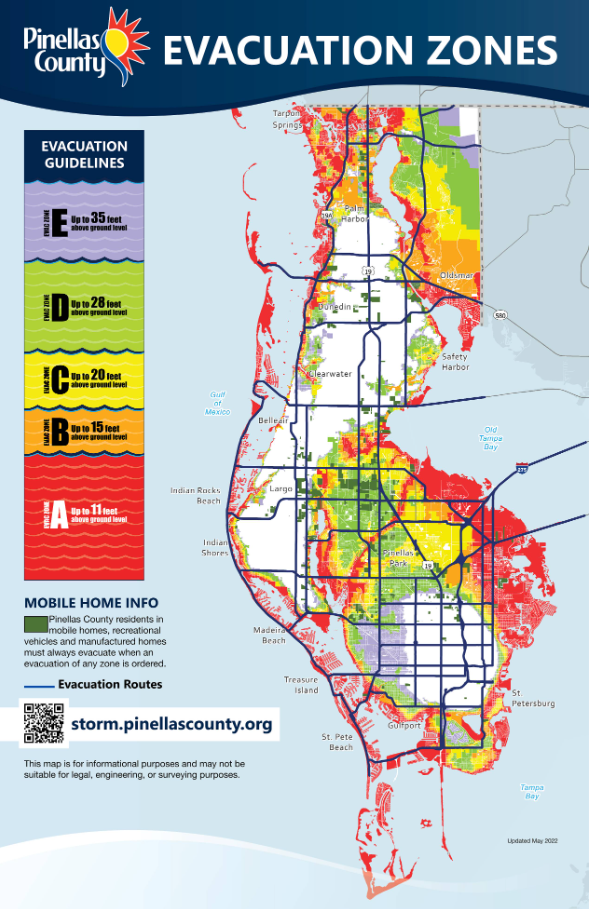
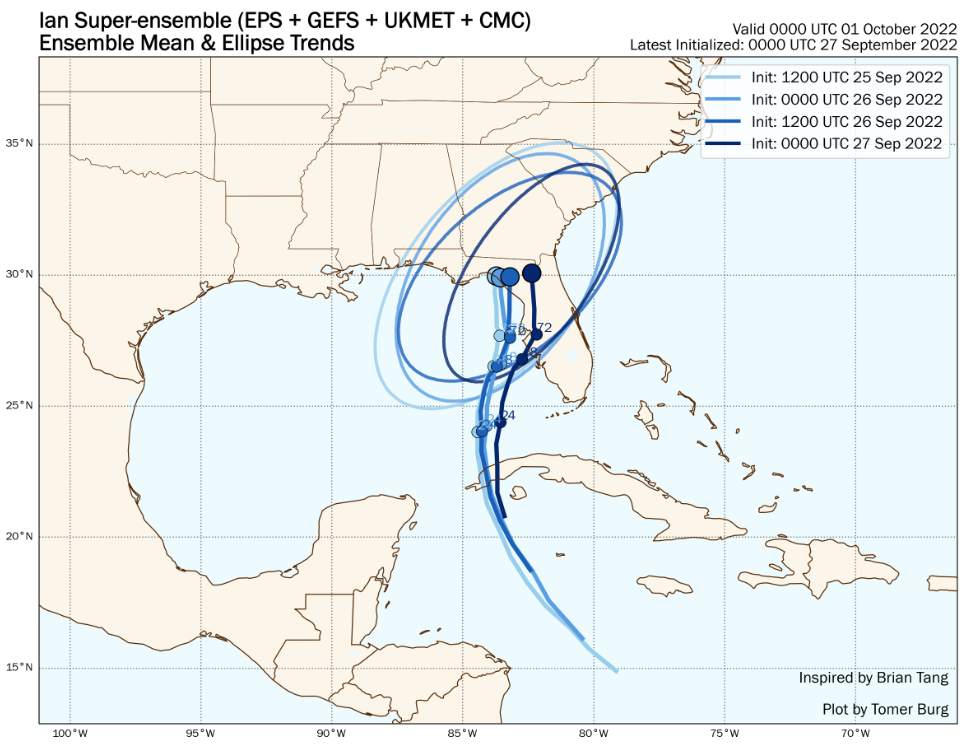
  • Tampa Metro Area at High Risk for Major Damage: Weather model consensus is building more evidence for catastrophic impacts to the Tampa, FL metropolitan region. As of 6PM EDT Monday September 26, mandatory evacuations for the lowest lying "Zone A" areas of counties were issued across the coastal Tampa region. Mandatory Zone B and C areas, with ground heights up to 20 feet above sea-level, went into effect 7AM EDT Tuesday September 27 across Pinellas and Hillsborough counties. Hurricane force winds are anticipated in the hurricane warning zones by Wednesday morning and could last for 48 hours in duration, with the current NHC forecast calling for a major category-3 landfall overnight Wednesday evening into Thursday morning.
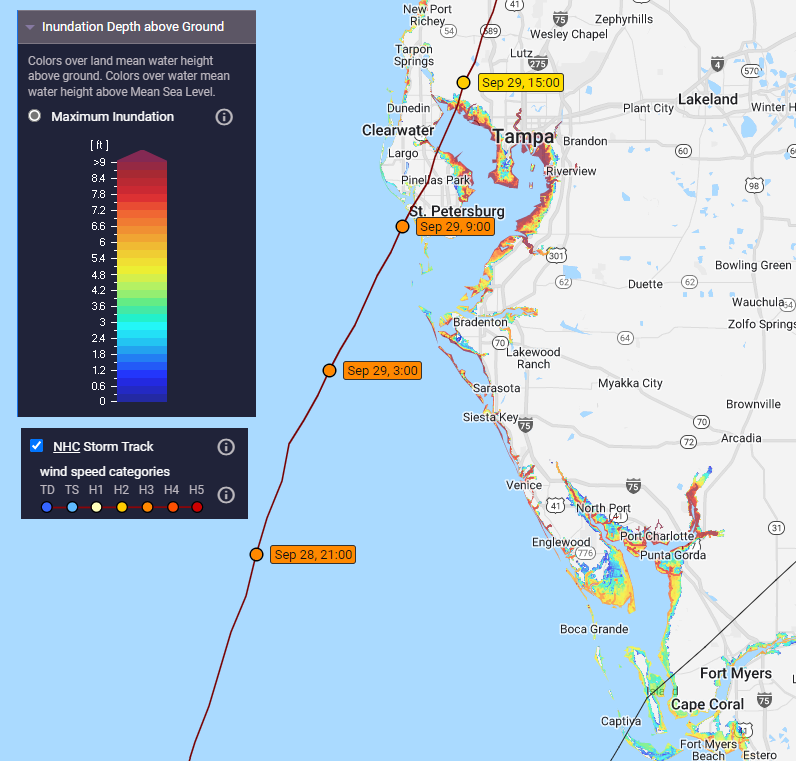
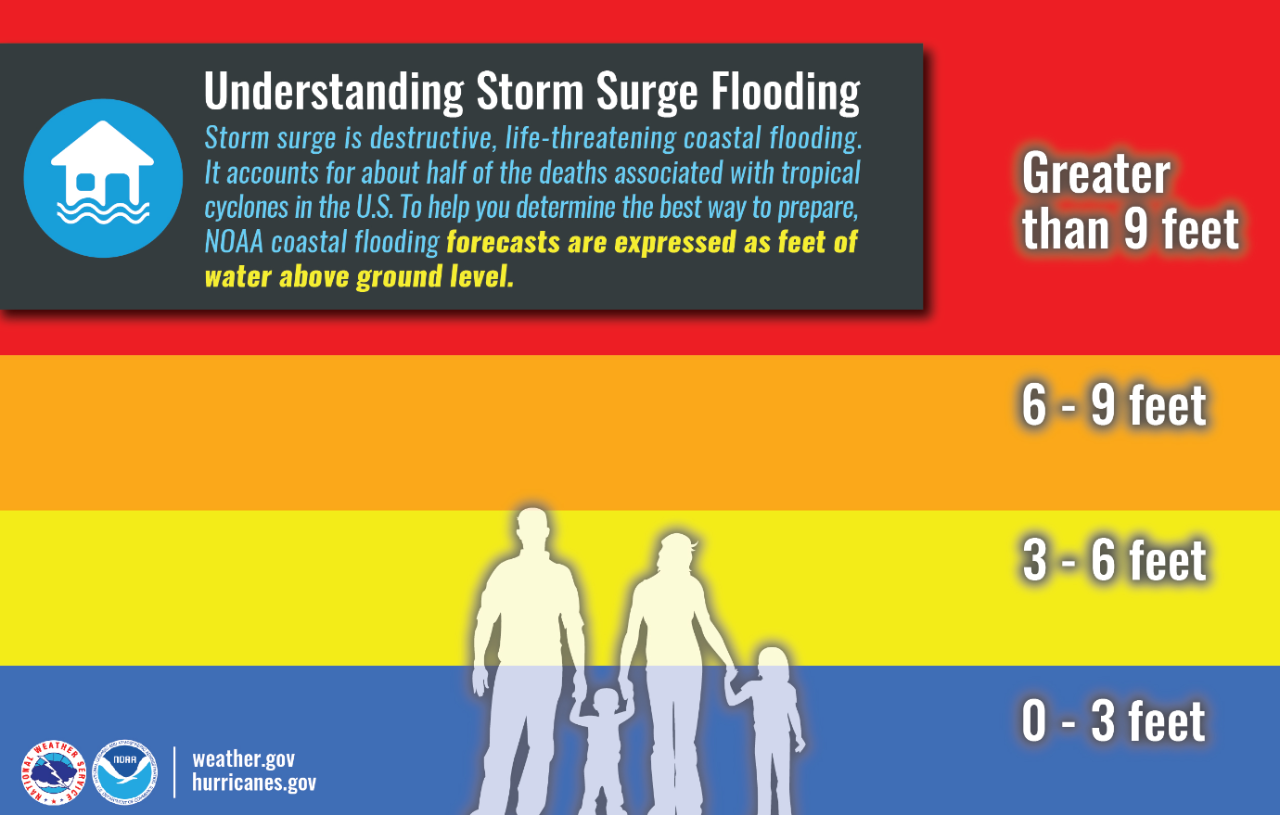
  • Ian's Forward Speed to Slow Significantly, Bringing Devastating Flooding from Storm Surge and Inland Rainfall: The west coast of Florida is highly susceptible to large storm surge events due to the bathymetry of the Gulf of Mexico sea floor, gently rising over hundreds of miles to the shore. Specifically, Tampa Bay's coastal orientation increases the risk further, and the region is extremely vulnerable to storm surge inundation with peak surge levels potentially in excess of ten feet. In conjunction with rainfall totals now projected to be nearing 20" in the most heavily impacted areas, widespread and historic flooding is increasingly likely.
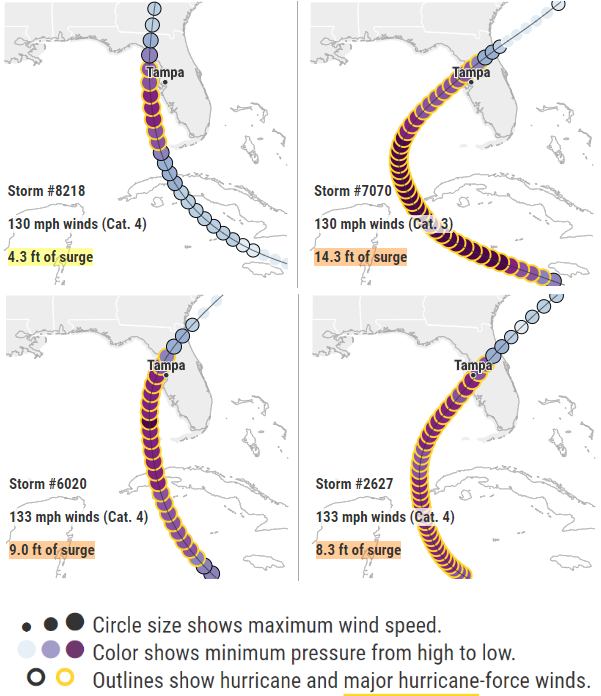
  • Recent Forecast Trends: Over the last two days, the main question was when would the spread of weather models start to converge on a more likely outcome? Unfortunately for the Tampa metro region, a track slowing just offshore with landfall likely within 50 miles of Tampa Bay is a near worst case scenario for damage to the region. Small wobbles that are challenging to forecast in advance are likely to be the final factor governing the severity of wind and storm surge impacts at any given location. Accordingly, the Guy Carpenter analysis of analog historical events with an industry loss ranging from USD 15 billion to USD 35 billion continues to grow an initial potential industry loss range.


Population sprawl and density growth across metropolitan Tampa Bay, FL, comparing 1950 to 2020. Click image for a decadal animation.  Source: Dr. Stephen Strader, Villanova University.
Population sprawl and density growth across metropolitan Tampa Bay, FL, comparing 1950 to 2020. Click image for a decadal animation. Source: Dr. Stephen Strader, Villanova University.
The population of the Tampa Bay, FL metropolis has grown by 14% since 2010 and nearly 300% in 50 years.  Source: US Census.
The population of the Tampa Bay, FL metropolis has grown by 14% since 2010 and nearly 300% in 50 years. Source: US Census.
The NHC track forecast and potential inundation depth of storm surge above ground, click on map to access the latest forecast from CERA and the National Hurricane Center.  Small shifts in the ultimate landfall will have pronounced impact on highest storm surge depths in various bays and estuaries along the Gulf of Mexico coastline. Source: Coastal Emergency Risks Assessment.
The NHC track forecast and potential inundation depth of storm surge above ground, click on map to access the latest forecast from CERA and the National Hurricane Center. Small shifts in the ultimate landfall will have pronounced impact on highest storm surge depths in various bays and estuaries along the Gulf of Mexico coastline. Source: Coastal Emergency Risks Assessment.
Pinellas County evacuation zones, with Zones A, B and C currently under mandatory evacuation; click the map for an interactive map platform to view other parts of Florida.  Source: Pinellas County, Florida Department of Emergency Management.
Pinellas County evacuation zones, with Zones A, B and C currently under mandatory evacuation; click the map for an interactive map platform to view other parts of Florida. Source: Pinellas County, Florida Department of Emergency Management.
The Tampa Bay times storm surge simulator, in partnership with scientists Dr. Ning Lin and Dr. Kerry Emanuel of MIT. Click on map to access the freely available storm surge simulator.  Source: Tampa Bay Times / tampabay.com.
The Tampa Bay times storm surge simulator, in partnership with scientists Dr. Ning Lin and Dr. Kerry Emanuel of MIT. Click on map to access the freely available storm surge simulator. Source: Tampa Bay Times / tampabay.com.
Public service announcement from NOAA/NWS regarding the impact of storm surge, the largest driver of fatalities in tropical cyclones.  Source: NOAA/NWS.
Public service announcement from NOAA/NWS regarding the impact of storm surge, the largest driver of fatalities in tropical cyclones. Source: NOAA/NWS.
Consensus weather model output highlighting that an eastward shift has been seen in the last 48 hours of weather model output, with darker blues indicating the latest issued consensus forecast view. Source: Dr. Brian Tang, University at Albany, Tomer Burg.
NFIP residential policy take-up rates for the state of Florida; the most heavily impacted areas on the coast have between 15% to 25% penetration between Tampa and Port Charlotte, FL. Inland counties predominantly see less than 5% take-up of NFIP policies. Source: FEMA, US Census, Guy Carpenter.

Additional links of interest:
NOAA Ian Dedicated Website
NOAA Storm Surge Data
USGS Flood Event Viewer
U.S. National Hurricane Center
U.S. National Weather Service
Interactive Florida Evacuation Zone Map
Tampa Bay Storm Surge Simulator

The next update on Hurricane Ian will be issued Wednesday September 27.  Statements from the National Hurricane Center and official emergency management and forecast agencies supersede this update and should be closely followed concerning matters of personal safety.

Footer