California was impacted by a series of atmospheric rivers between December 26, 2022 to January 17, 2023. The storm brought torrential rains, widespread flooding, and landslides to nearly the entire state. A Presidential Major Disaster Declaration was put into effect in 41 out of California’s 58 counties. Over 96,000 residents were evacuated, 500,000 homes and businesses were left without power, and 20 total fatalities were reported.
Event Impacts
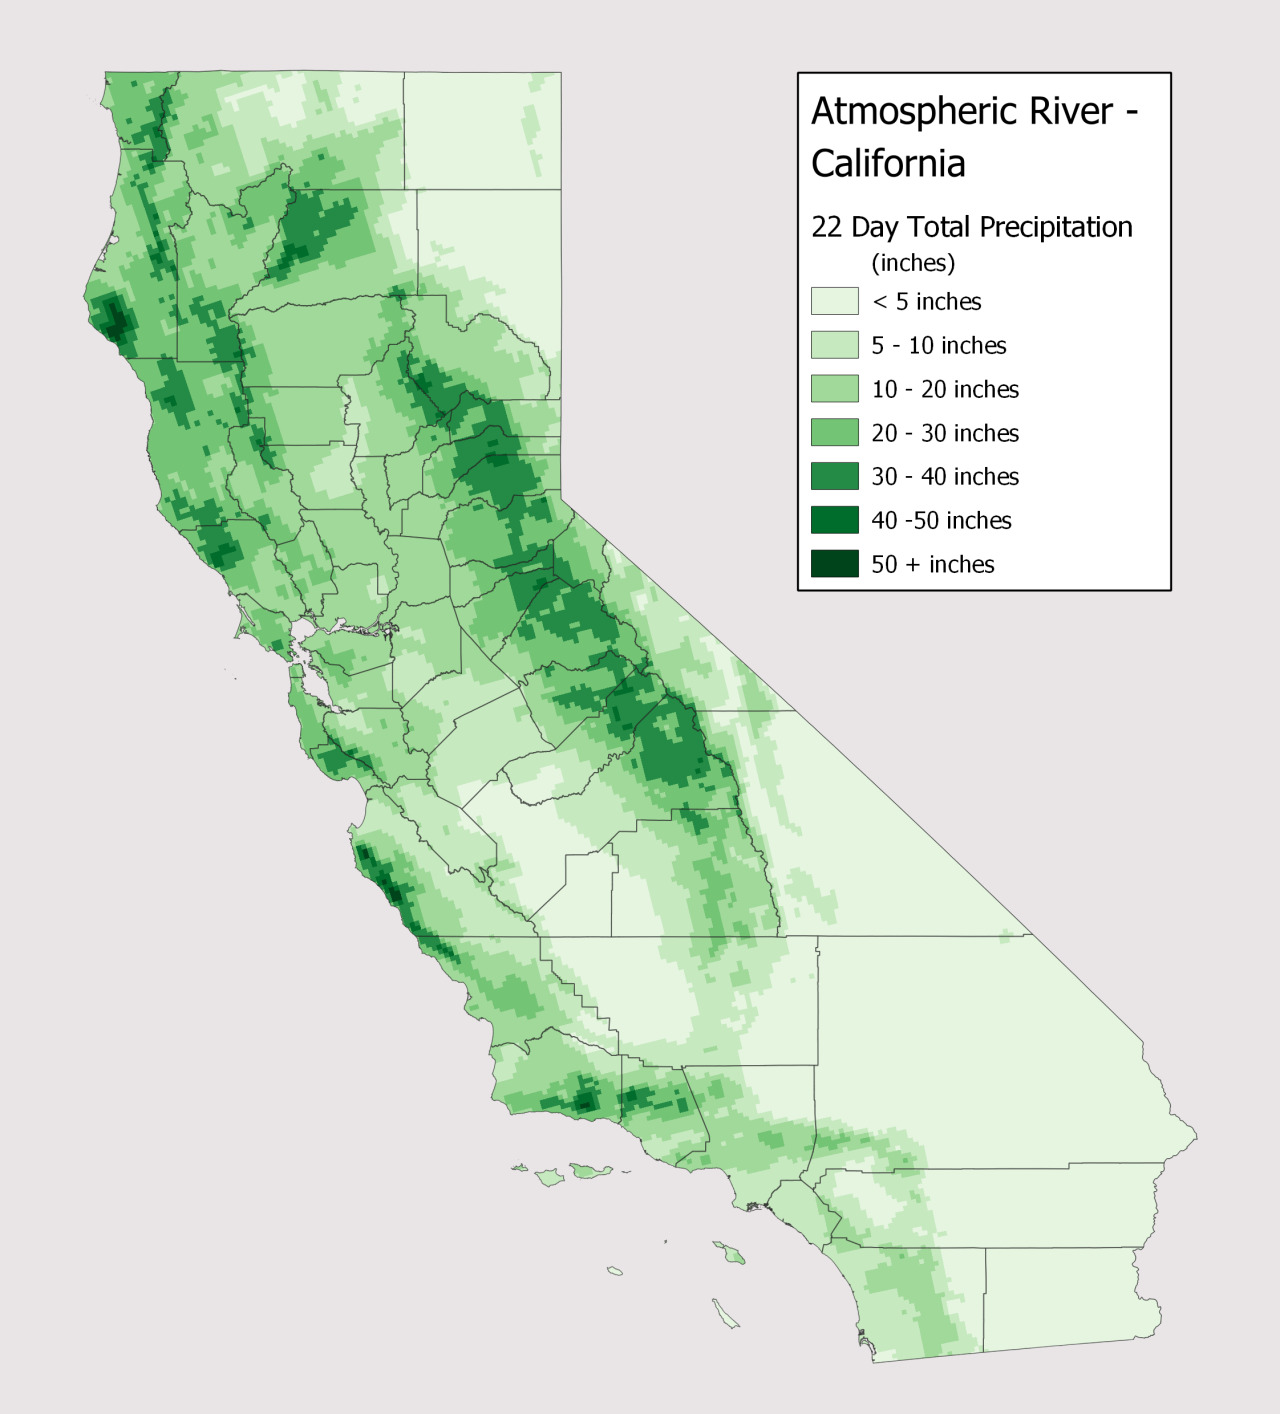
1) Extreme Rainfall Totals
The updated total precipitation map for California shows a period of 22 days stretching from December 26 to January 17. The average over the entire state in that time frame was 11.47 inches, with several locations in Central California setting 3-week records. An estimated 30 trillion gallons of water were dumped over California between December 26 and January 17. Many parts of California received between 40-90% of their normal annual rainfall, especially around the San Francisco Bay area.
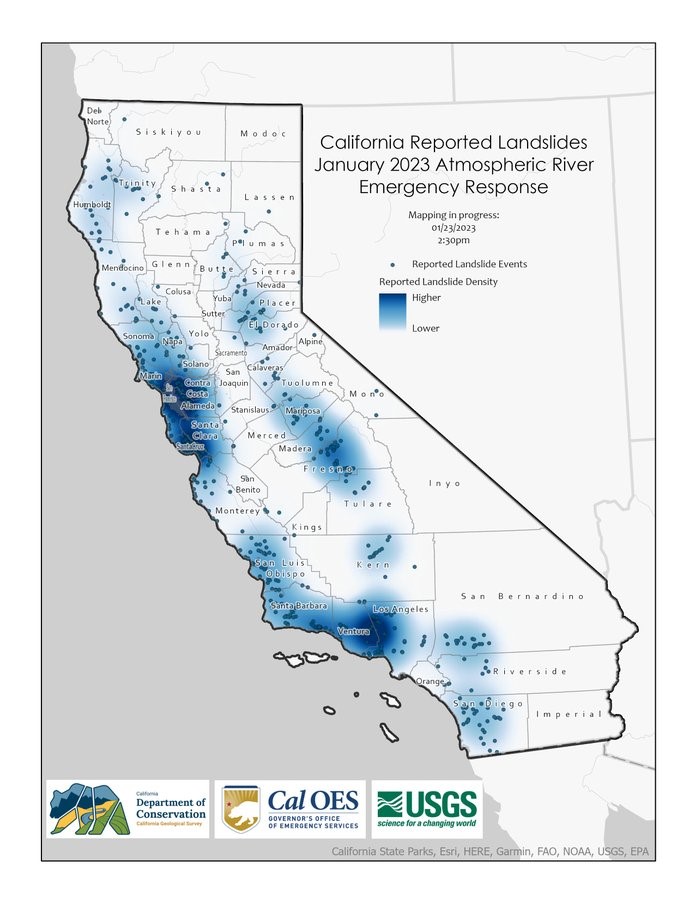
2) Land and Mudslides
California Geological Survey has mapped almost 600 landslides since December 30, 2022. California as a state is particularly vulnerable to landslides, especially with the combination of heavy rainfall and prolonged drought conditions hardening soil. Additionally, wildfire scars have removed vegetation to hold soil in place. Crews continue to respond at numerous landslide locations on Highway 1, as the torrential rains created significant instability.
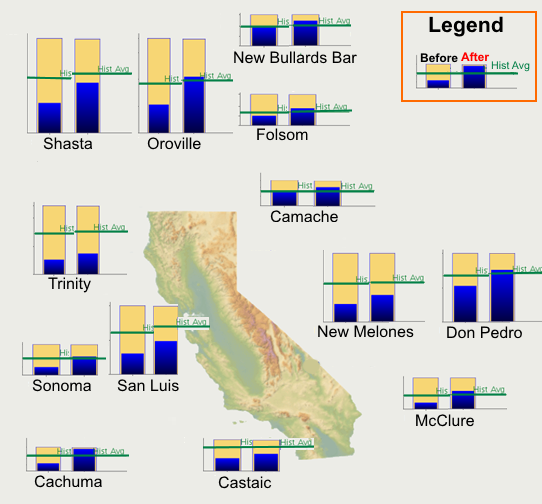
3) Flood Defenses, Mixed Performance
California has more than 20,000 miles of levees and channels and more than 1,500 dams and reservoirs, protecting around 1.3 million people and $223 billion worth of properties. California’s major reservoirs were far below normal levels due to long-term drought. Post-event, many are now near or above historical averages. Multiple levees along the Consumes River broke during the January 2023 event, resulting in inundation of farm-land and interruption of transportation.
4) Riverine and Flash Flooding
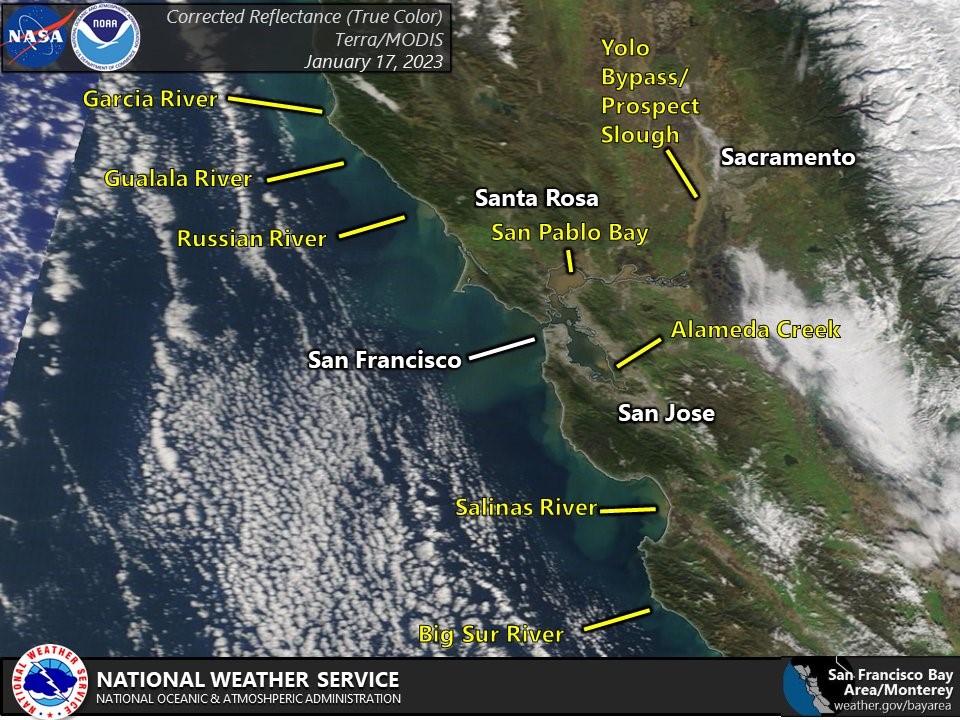
A total of 955 flood, flash flood, or debris flow reports were logged by the California National Weather Service offices. On January 13, the flooding of the Salinas River was so severe that Monterey Peninsula—located along California’s central coastline—effectively became an island. Evacuation warnings were in place on evening of January 15 for residents near the Carmel River in Monterey County on California’s Central Coast. Creek and river runoff was strong enough to show up on MODIS satellite imagery.
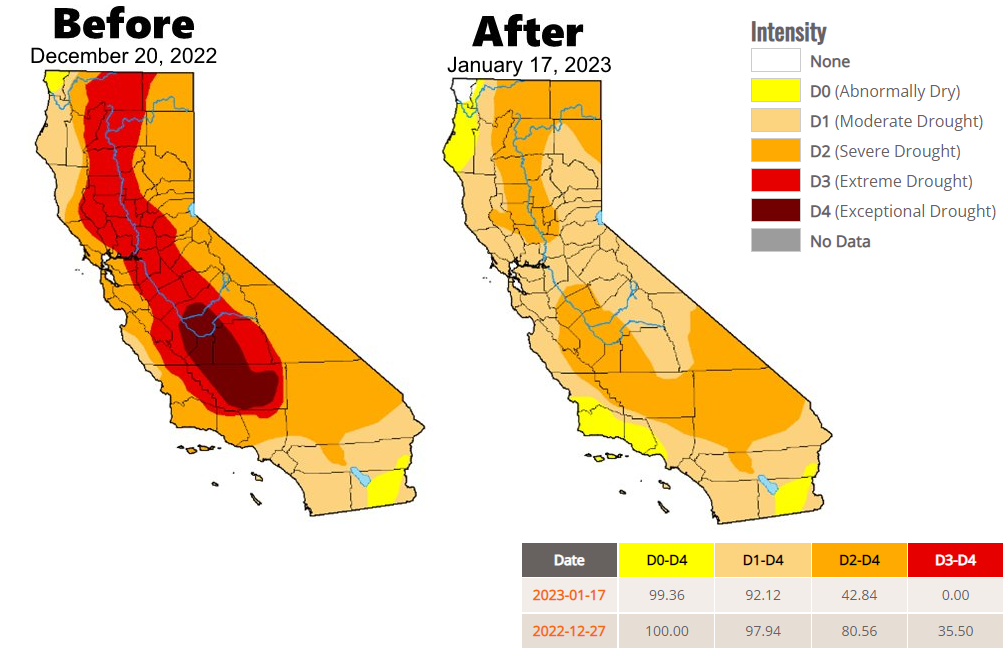
5) Drought Alleviation
Before the atmospheric river events, 40% of California was under extreme drought (D3). The rainfall brought enough drought relief to bring extreme drought conditions to 0%. However, more precipitation is needed to replenish the reservoirs, as California is still recovering from its driest three-year period on record.
Implications for the Insurance Industry
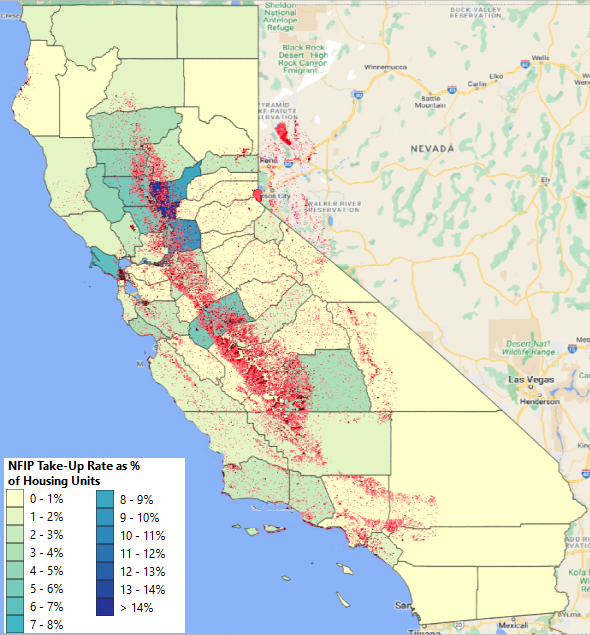
According to Moody’s RMS®, the atmospheric river event caused an estimated $5-7 billion dollars in economic losses but only $500 million to $1.5 billion in insured losses. This is due to low take-up rates from the National Flood Insurance Program (NFIP) in California. The highest NFIP take-up rate is 14% in Sutter County, located in Central California. For residential risks in Central Valley, most counties have between 1% to 8% of insurable properties covered. This has resulted in a large flood insurance coverage gap in California and explains the low insured losses estimate.
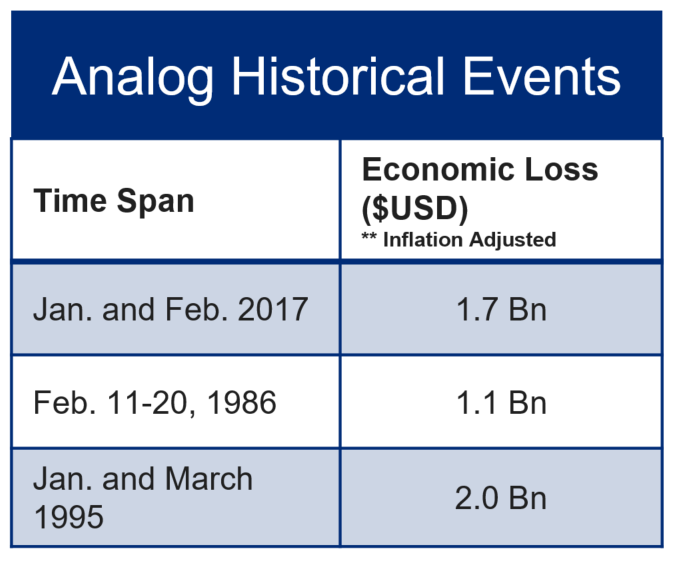
Historical Analogues
As seen in the Guy Carpenter selection of top analog historical events (below), atmospheric rivers are common in California. Of the historical events, the 2017 atmospheric river is most comparable in duration and flooding impacts. The 1986 flood was overall a shorter event, but it had more intense rainfall. Finally, the floods of January and March of 1995 are unique as they cover two separate events a month apart and showcase how repeat events can increase the risk of a severe event.