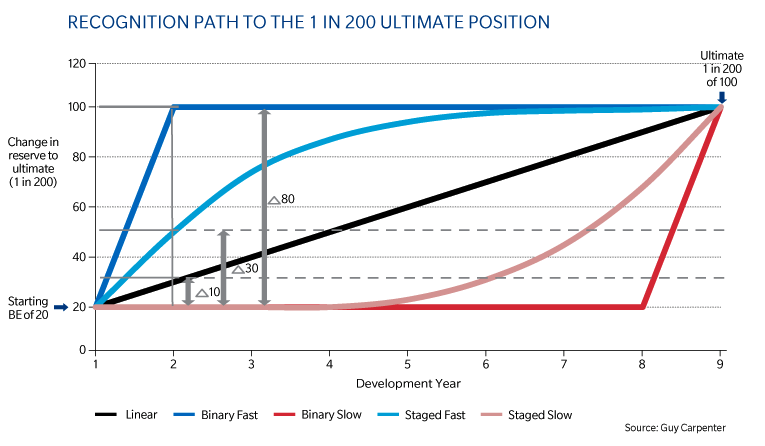
The chart below attempts to illustrate the solvency calculation issue. Suppose the best estimate is 20 and the assessment from modeling is that the 1-in-200-year ultimate loss is 100. If all else stays the same and with the simplifying assumption that the yield curve stays flat, one can say that the sum of the 1-year solvency capital requirements (SCRs) approximated the difference between 100 and 20 (i.e. 80). Yet, because of the discounting, when in time the change in own funds is recognized, is important. The black line represents a linear recognition pattern so the 1-year SCRs are all equal with increments of 10. The blue line represents a Binary Fast recognition so the first year SCR is 80 and the remaining years' SCR are zero. This means that the deterioration is recognized quickly. The red line again shows binary recognition but with a slow pattern as the movement is only occurring toward the end of the liabilities' life. The two curves in light blue and light red represent less severe versions of the binary forms.

Consider which lines of business could have these sorts of recognition patterns. The Binary Fast line is analogous to property cat for example. The loss would be known and reserved for in a short space of time so the one-year change in own funds would be large and thereafter would be zero or minimal. The linear recognition line could be representative of an annuity business with a creeping change in longevity assumptions as improving mortality tables are released each year. The Binary Slow line could equally apply to some sort of life time annuity provision where there was a one-off, overnight huge medical advance such as a cure for cancer. Most types of business will be something in between the envelopes provided by the staged-fast and staged-slow curves.
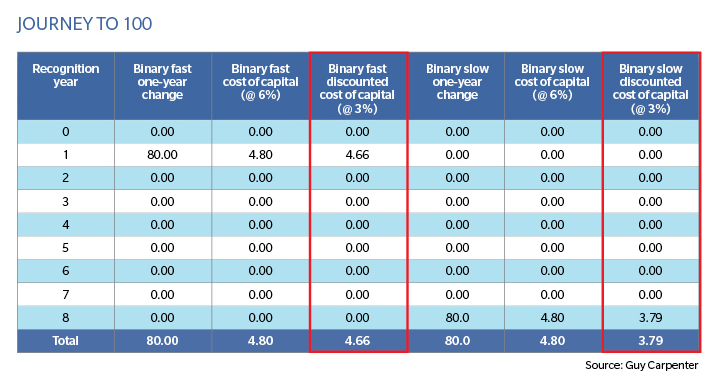
The table below shows a simplified example of how the recognition of the journey to 100 makes a difference to the value of the risk margin when the two recognition extremes Binary Fast and Binary Slow are examined using a flat risk-free yield curve of 3 percent.

For Binary Fast, the effect of discounting is minimal, taking the cost of capital from 4.8 down to 4.66. For Binary Slow, it is much more significant, taking it to 3.79, which represents a 21 percent reduction.
The point of this simplified exercise is to illustrate that for emerging risks it is very unclear exactly how they will be recognized. Subsequently, as well as quantum we need to consider timing carefully, as this can be influential on the size of the risk margin and hence surplus.